
Avalon
Creator
Fri, May 8, 2026, 07:37 PM
Sofia, Bulgaria
42.64000, 23.33600
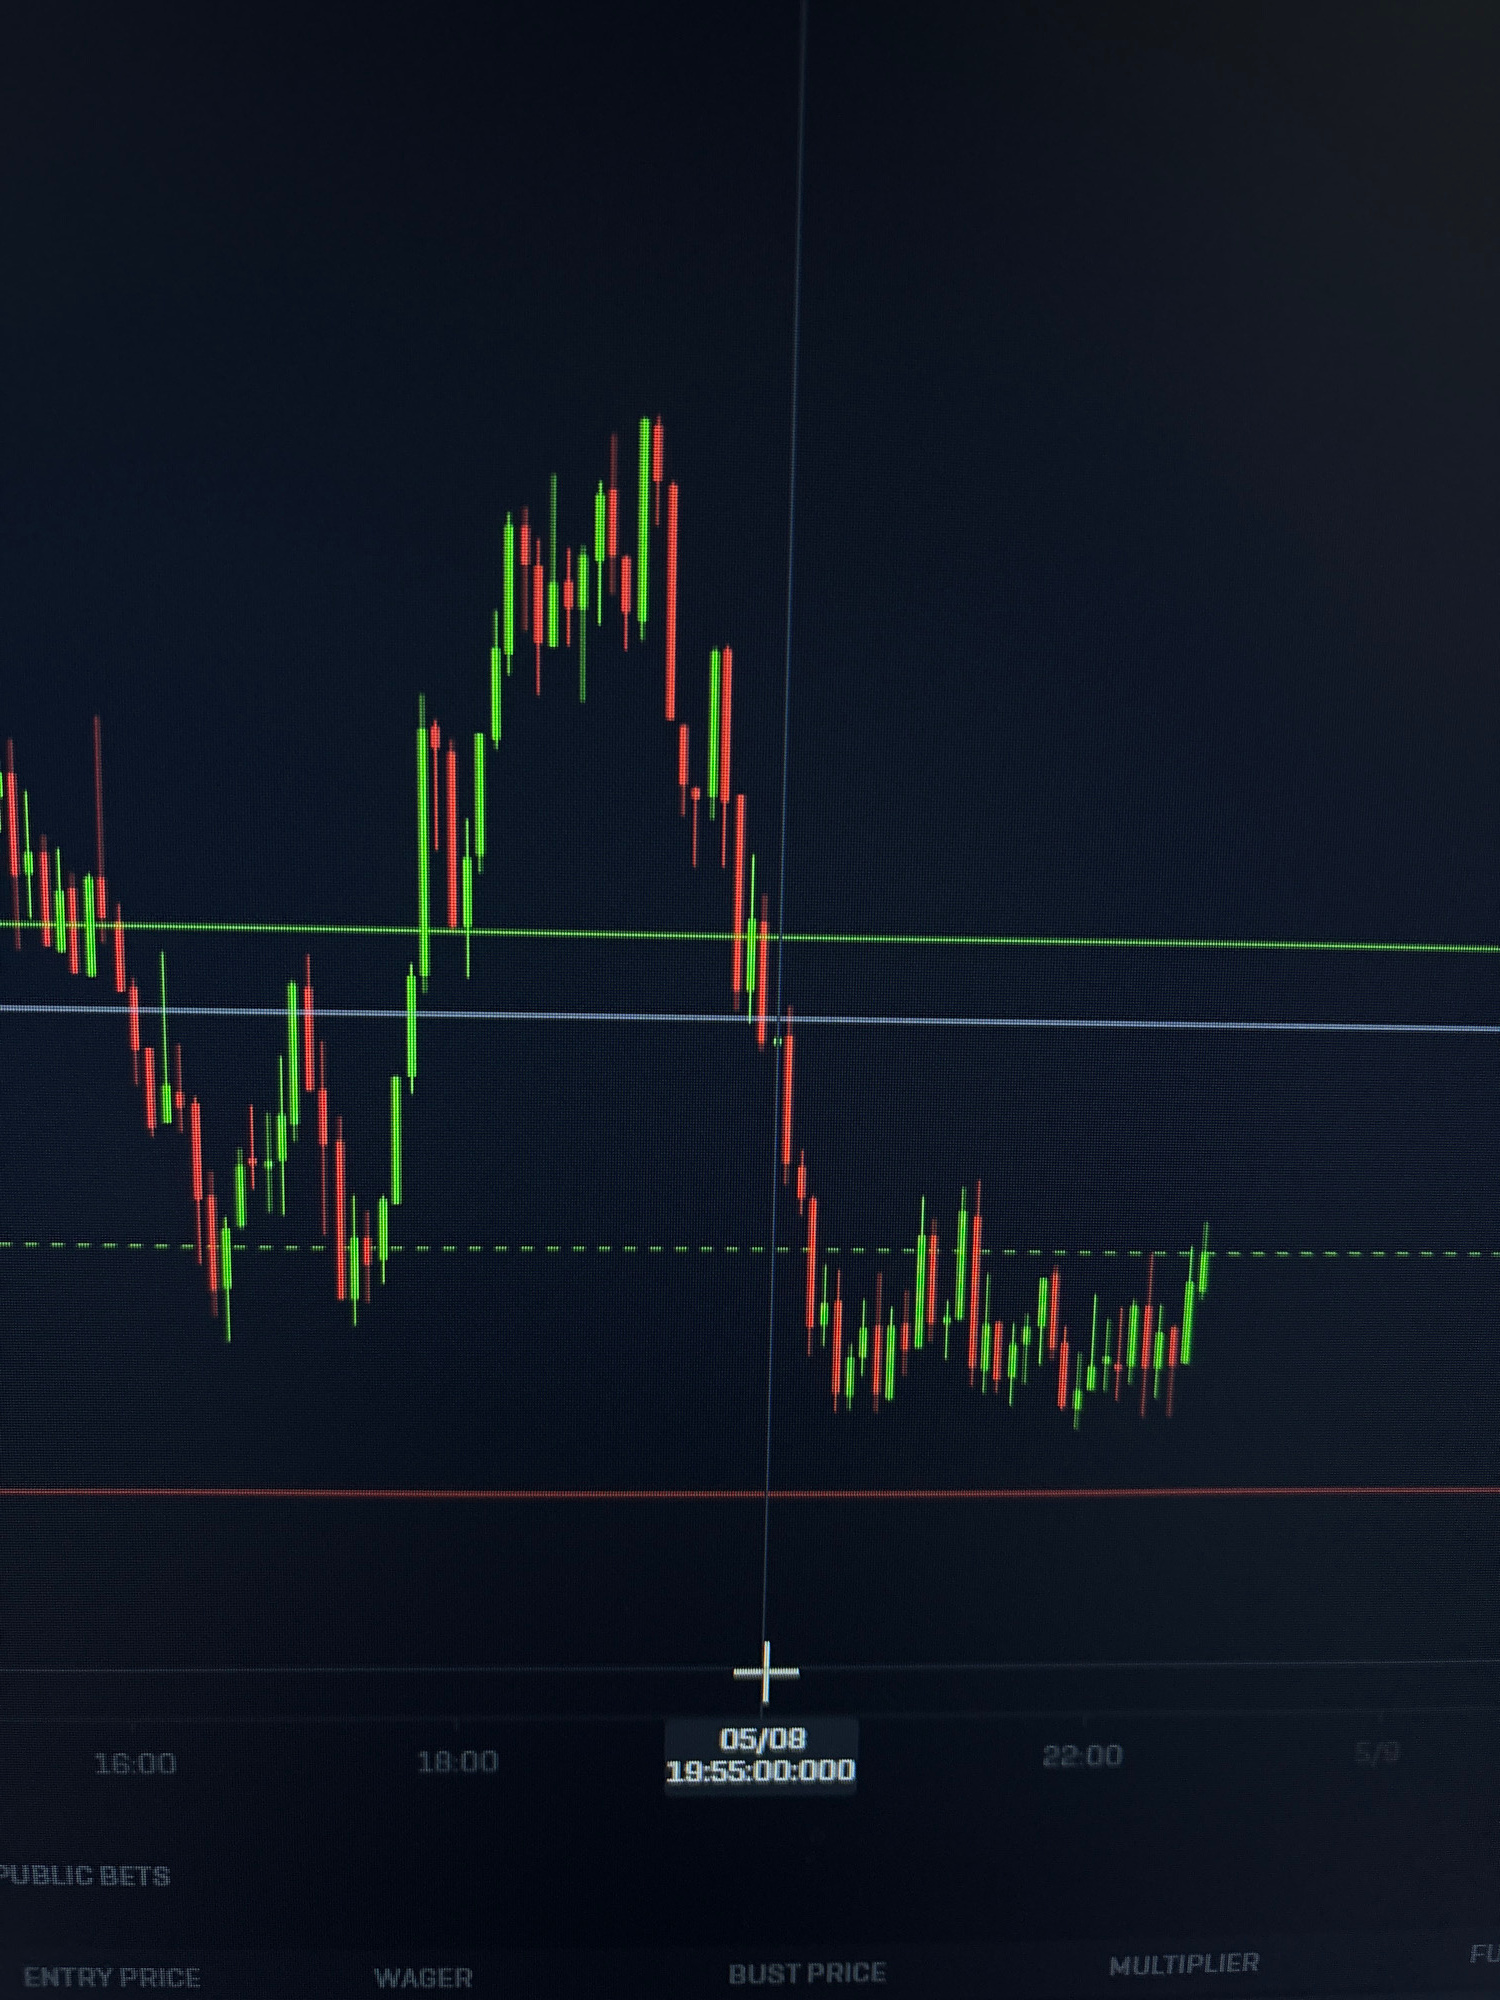
The image shows a candlestick chart, often used in financial markets to visualize price movements over time. The chart displays green and red horizontal bars representing price fluctuations, with gree…read more
anxiety
uncertainty
tension
excitement
volatility
Technical
ID
7c146876-b5b7-4367-b
Usage Rights
This media is free for non-commercial use with proper attribution.
Commercial use, AI/ML training, and derivative works are prohibited without explicit consent from the creator.
Licensed under CC BY-NC 4.0 with additional AI/ML restrictions. Full terms →