
Sign in
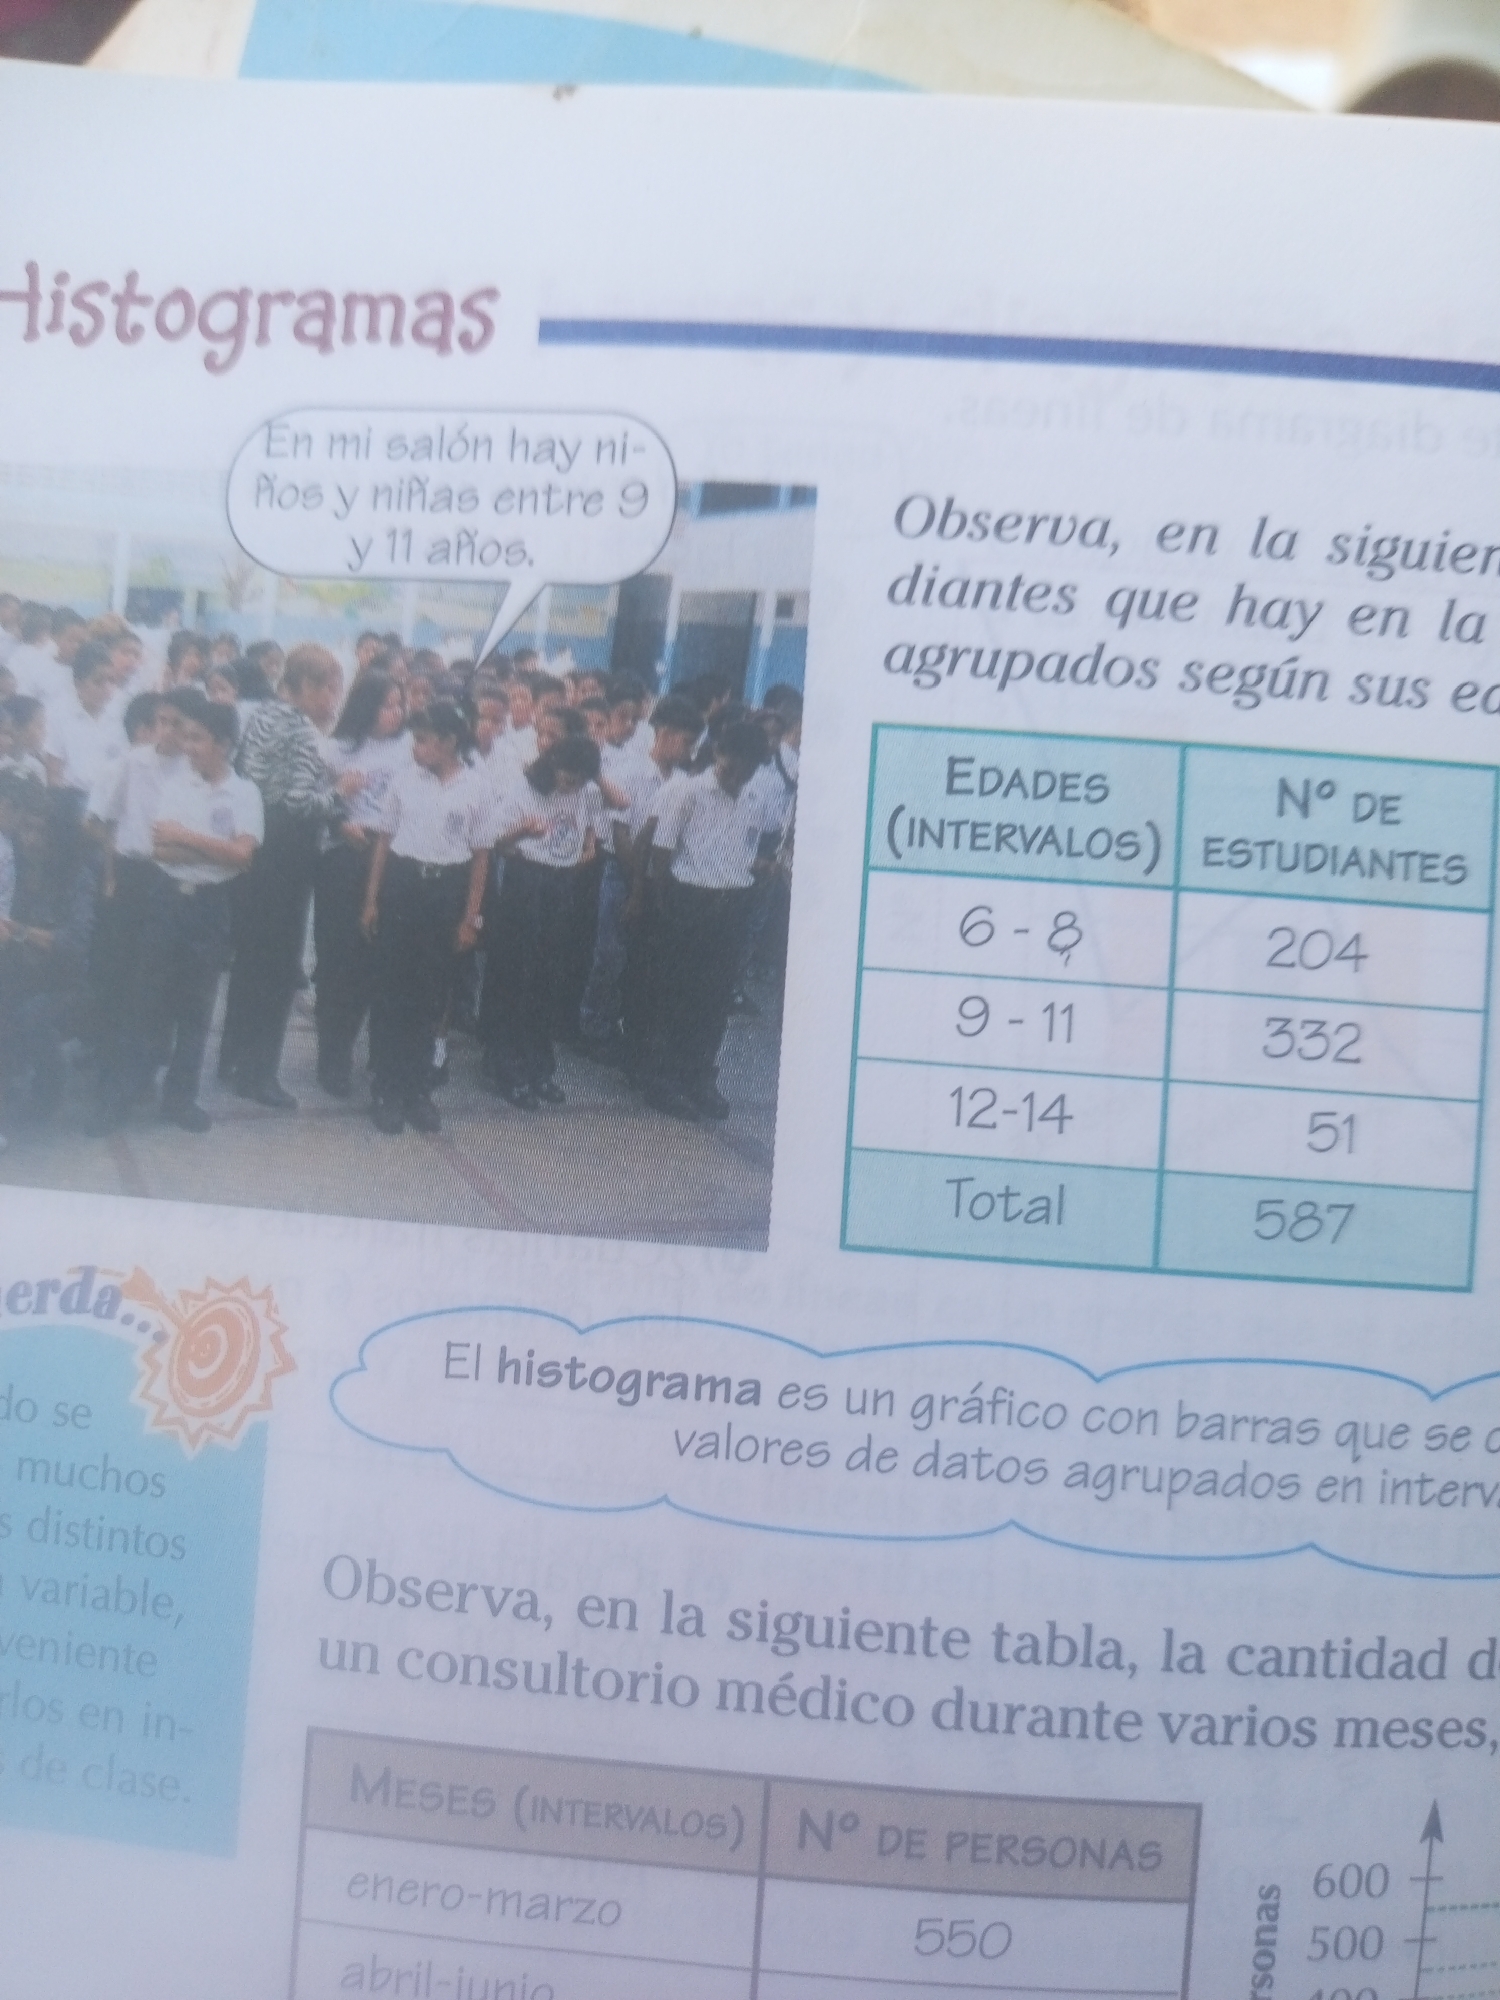
The image displays a page from a book or educational material. The top left corner has the title "Histogramas" in a stylized font. Below this, a speech bubble contains text in Spanish: "En mi salón hay ni- ños y niñas entre 9 y 11 años." This translates to "In my classroom, there are boys and girls between 9 and 11 years old." A group of children and a few adults are visible in the background, appearing to be in a school setting, possibly outdoors.

To the right, a text box contains the Spanish phrase: "Observa, en la siguiente tabla, la cantidad de estudiantes que hay en la agrupados según sus eda". This translates to "Observe, in the following table, the number of students there are grouped by their ages." Beneath this text is a table with two columns: "EDADES (INTERVALOS)" (AGES (INTERVALS)) and "N° DE ESTUDIANTES" (NO. OF STUDENTS). The table shows age intervals: 6-8 with 204 students, 9-11 with 332 students, 12-14 with 51 students, and a total of 587 students.

Further down, on the left, a section labeled "¡Recuerda!" (Remember!) with a sun graphic has some faded Spanish text. On the right, another speech bubble contains text in Spanish: "El histograma es un gráfico con barras que se... valores de datos agrupados en interva". This translates to "The histogram is a bar graph that... data values grouped in intervals". Below this, there is more faded text in Spanish, starting with "Observa, en la siguiente tabla, la cantidad de... un consultorio médico durante varios meses,". This translates to "Observe, in the following table, the number of... in a medical clinic during several months,". Following this is another table with columns "MESES (INTERVALOS)" (MONTHS (INTERVALS)) and "N° DE PERSONAS" (NO. OF PEOPLE). The first row shows "enero-marzo" (January-March) and "550" people, and the second row shows "abril-junio" (April-June). A partial bar graph scale is visible on the far right, with numbers 600, 500, and 400.

There is no information in the image that indicates the location is the city of La Tagua, Venezuela. The image content is exclusively related to educational material about histograms and data representation.
Alejandra Jiménez

Jun 17, 2026, 6:42 PM

La Tagua, Venezuela

Short Term

Stake attention in this memory

curiosity
learning
educational
analytical
informative

The image displays a page from a book or educational material. The top left corner has the title "Histogramas" in a stylized font. Below this, a speech bubble contains text in Spanish: "En mi salón hay ni- ños y niñas entre 9 y 11 años." This translates to "In my classroom, there are boys and girls between 9 and 11 years old." A group of children and a few adults are visible in the background, appearing to be in a school setting, possibly outdoors. To the right, a text box contains the Spanish phrase: "Observa, en la siguiente tabla, la cantidad de estudiantes que hay en la agrupados según sus eda". This translates to "Observe, in the following table, the number of students there are grouped by their ages." Beneath this text is a table with two columns: "EDADES (INTERVALOS)" (AGES (INTERVALS)) and "N° DE ESTUDIANTES" (NO. OF STUDENTS). The table shows age intervals: 6-8 with 204 students, 9-11 with 332 students, 12-14 with 51 students, and a total of 587 students. Further down, on the left, a section labeled "¡Recuerda!" (Remember!) with a sun graphic has some faded Spanish text. On the right, another speech bubble contains text in Spanish: "El histograma es un gráfico con barras que se... valores de datos agrupados en interva". This translates to "The histogram is a bar graph that... data values grouped in intervals". Below this, there is more faded text in Spanish, starting with "Observa, en la siguiente tabla, la cantidad de... un consultorio médico durante varios meses,". This translates to "Observe, in the following table, the number of... in a medical clinic during several months,". Following this is another table with columns "MESES (INTERVALOS)" (MONTHS (INTERVALS)) and "N° DE PERSONAS" (NO. OF PEOPLE). The first row shows "enero-marzo" (January-March) and "550" people, and the second row shows "abril-junio" (April-June). A partial bar graph scale is visible on the far right, with numbers 600, 500, and 400. There is no information in the image that indicates the location is the city of La Tagua, Venezuela. The image content is exclusively related to educational material about histograms and data representation.

Symbol

0036E

Volume

5,843

Creator

+$0.07

Revenue

+$0.04

TVL

$2.79

1D
1W
1M
All

Loading AttnAds…

transactions
revenues
stakers
Earliest
Latest
Highest stake

1

Jesús Ferrer

Staked 27d ago
Redeemed 25d ago

$2.79 USD

+$0.01 USD

Fee: $0.03 (1%)

+0.5%

2

Rev Bot 🤖💰

Injected revenue 27d ago

Revenue bonus for the last stake.

+$0.04 USD

3

cruzaleja

Staked 27d ago

$2.79 USD

+$0.01 USD

+0.3%

4

Rev Bot 🤖💰

Injected revenue 27d ago

Revenue bonus for the last stake.

+$0.07 USD

More from this user

More from La Tagua

Alejandra Jiménez

Jun 17, 2026, 6:42 PM

La Tagua, Venezuela

Licensed under Creative Commons Attribution 4.0 International License. You are free to share and adapt this content with proper attribution.