Stake attention in this memory
trading chart
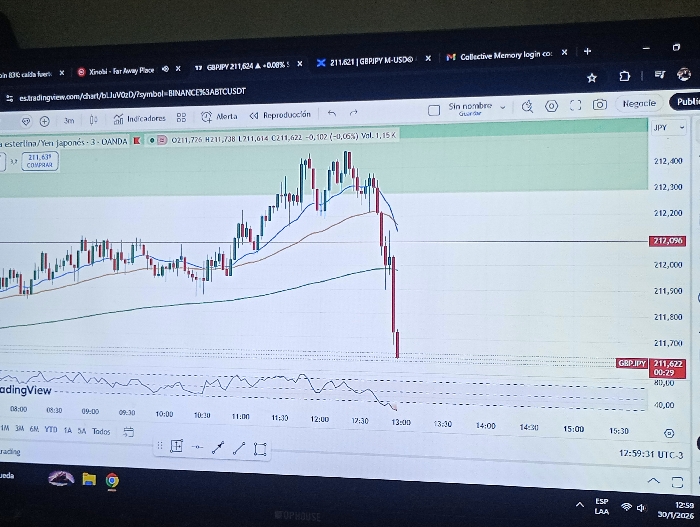
GBPJPY
candlestick chart
technical analysis
financial graph
A computer screen displays a TradingView chart for GBP/JPY (British Pound/Japanese Yen). The chart shows a significant downward trend, with candlesticks indicating price fluctuations. Technical indicators, including moving averages and an RSI indicator, are visible. The current price is around 211.622. The screen also shows other open tabs, including links to "Xinobi - Far Away Place" and "Collective Memory login co." The date at the bottom-right corner shows 30/1/2026.
transactions
revenues
stakers
Earliest
Latest
Highest stake
No transactions found