FM-d9t142
Jan 17, 2026, 5:16 AM
Stake attention in this memory
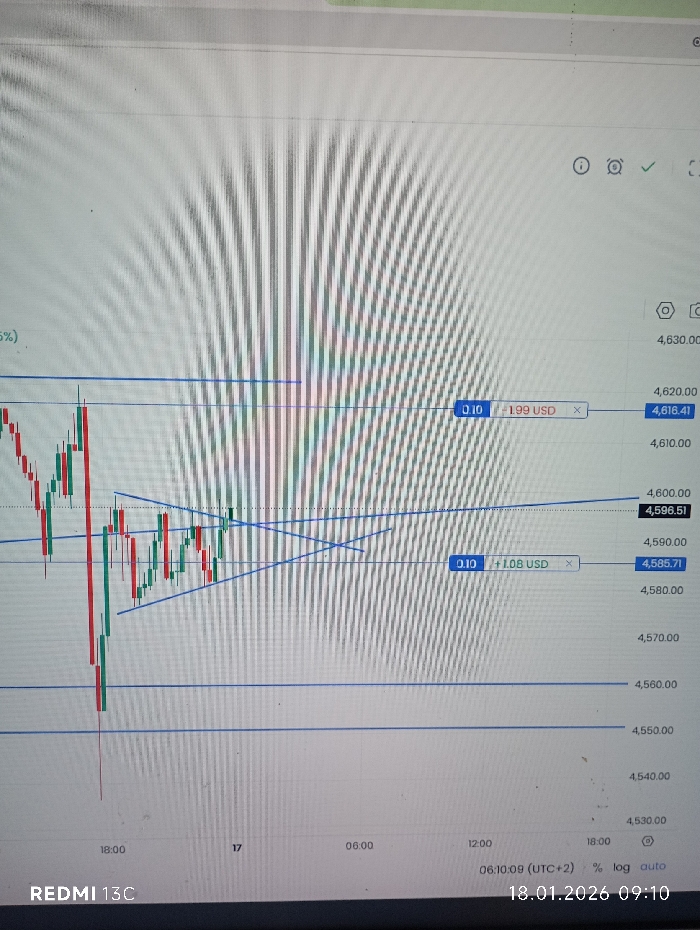
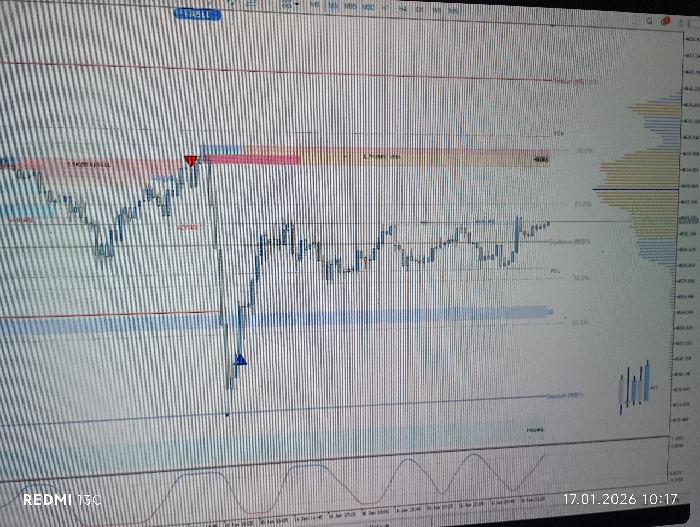
stock chart
cryptocurrency
market analysis
technical analysis
trading data
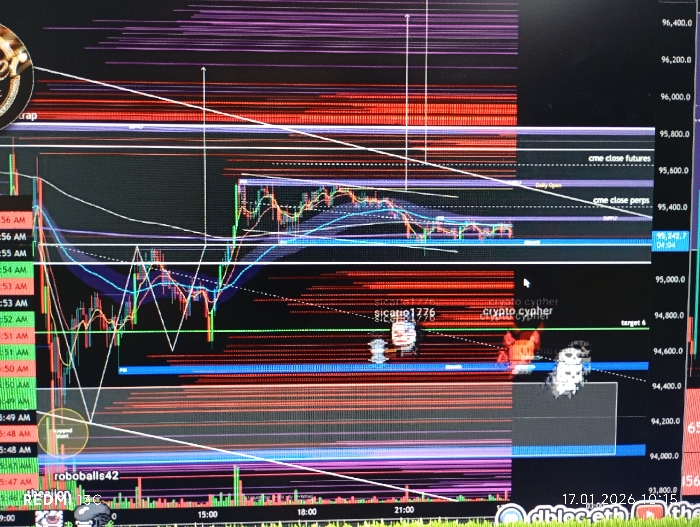
The image displays a cryptocurrency trading chart, likely Bitcoin, with price fluctuations represented by candlesticks. Various indicators and annotations clutter the chart. Horizontal lines mark potential resistance/support levels, and the "cme close futures/perps" labels suggest futures and perpetual contract closing prices. A couple of cartoonish, blurred illustrations overlay the chart. The timestamp "17.01.2026 10:15" indicates the data's date. Usernames "roboballs42" and handles "sicario1776," "crypto cypher" also appear.
Loading AttnAds…
transactions
revenues
stakers
Earliest
Latest
Highest stake
No transactions found
More from this user