Stake attention in this memory
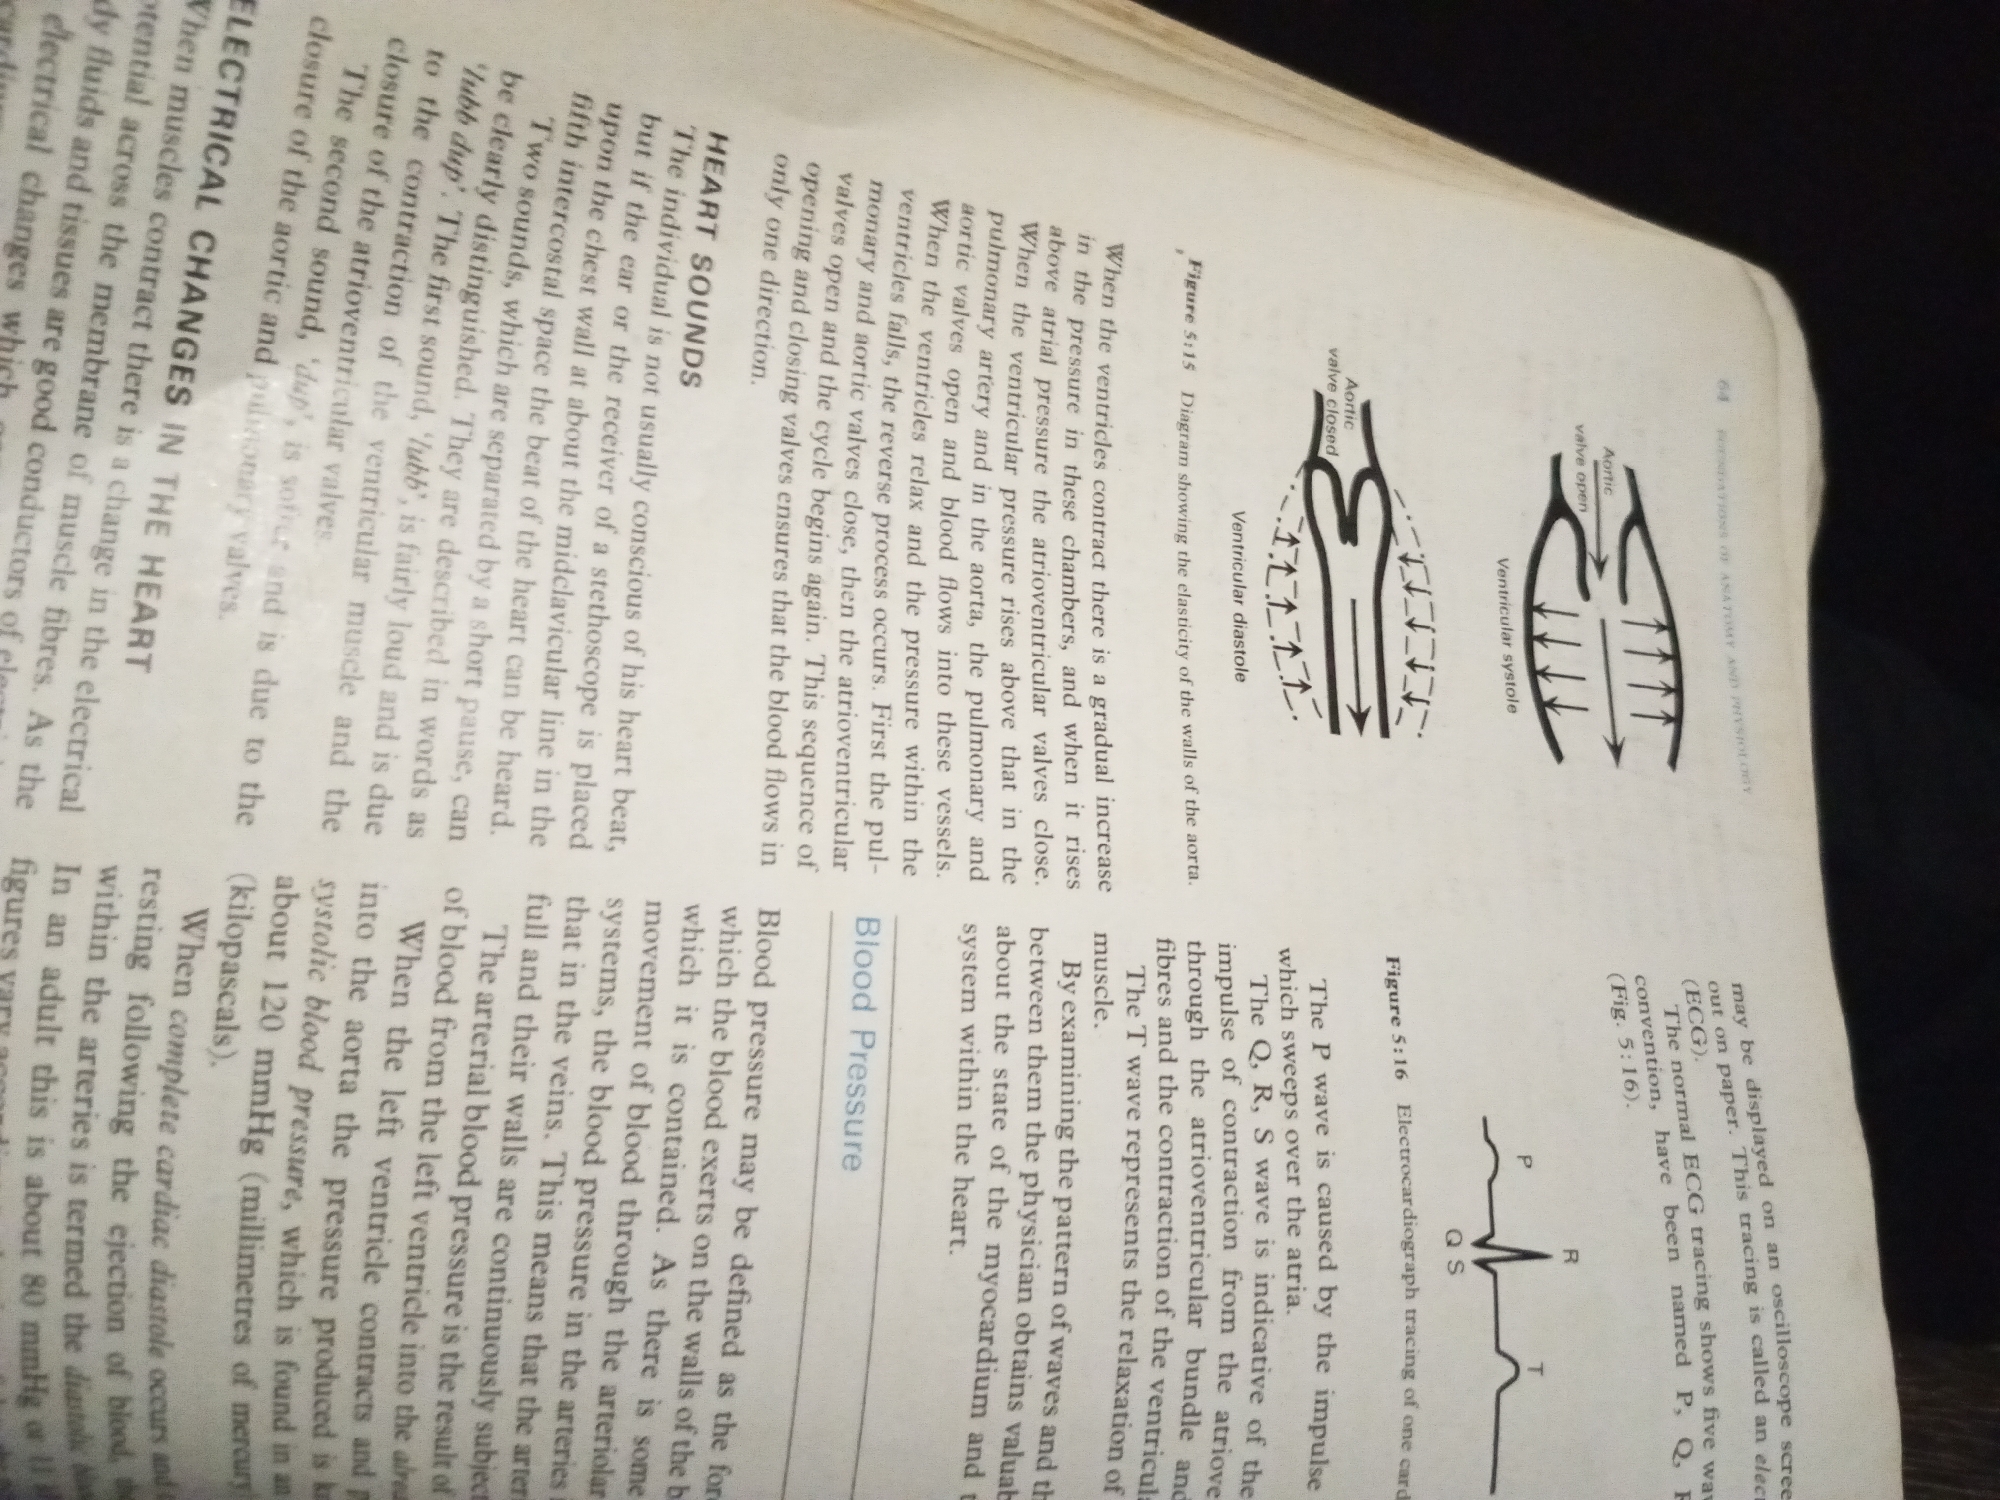
The image contains a page from a textbook with text and diagrams related to the circulatory system and electrocardiography. On the left side, there is a section titled "ELECTRICAL CHANGES IN THE HEART" followed by a paragraph describing the electrical activity of the heart. Below this, a heading "HEART SOUNDS" is followed by an explanation of the two main heart sounds. To the right of the text, there are two diagrams illustrating ventricular diastole and systole, with labels for aortic and ventricular valves. Further to the right, a caption refers to "Figure 5.15 Diagram showing the elasticity of the walls of the aorta." In the lower right section, there is a diagram labeled "Figure 5.16 Electrocardiograph tracing of one cardiac cycle (ECG)." This diagram shows a typical ECG waveform with P, Q, R, S, and T waves. The text discusses the P wave being caused by atrial contraction, and the Q, R, S wave indicating ventricular contraction. The overall image is a collection of educational material, likely from a biology or physiology textbook. There are no indications of a specific city or location.
Symbol
04344
Volume
9,299
Creator
+$0.12
Revenue
+$0.21
TVL
$9.48
2
Rev Bot 🤖💰
Injected revenue 1h ago
“Revenue bonus for the last stake.”
+$0.23 USD