Stake attention in this memory
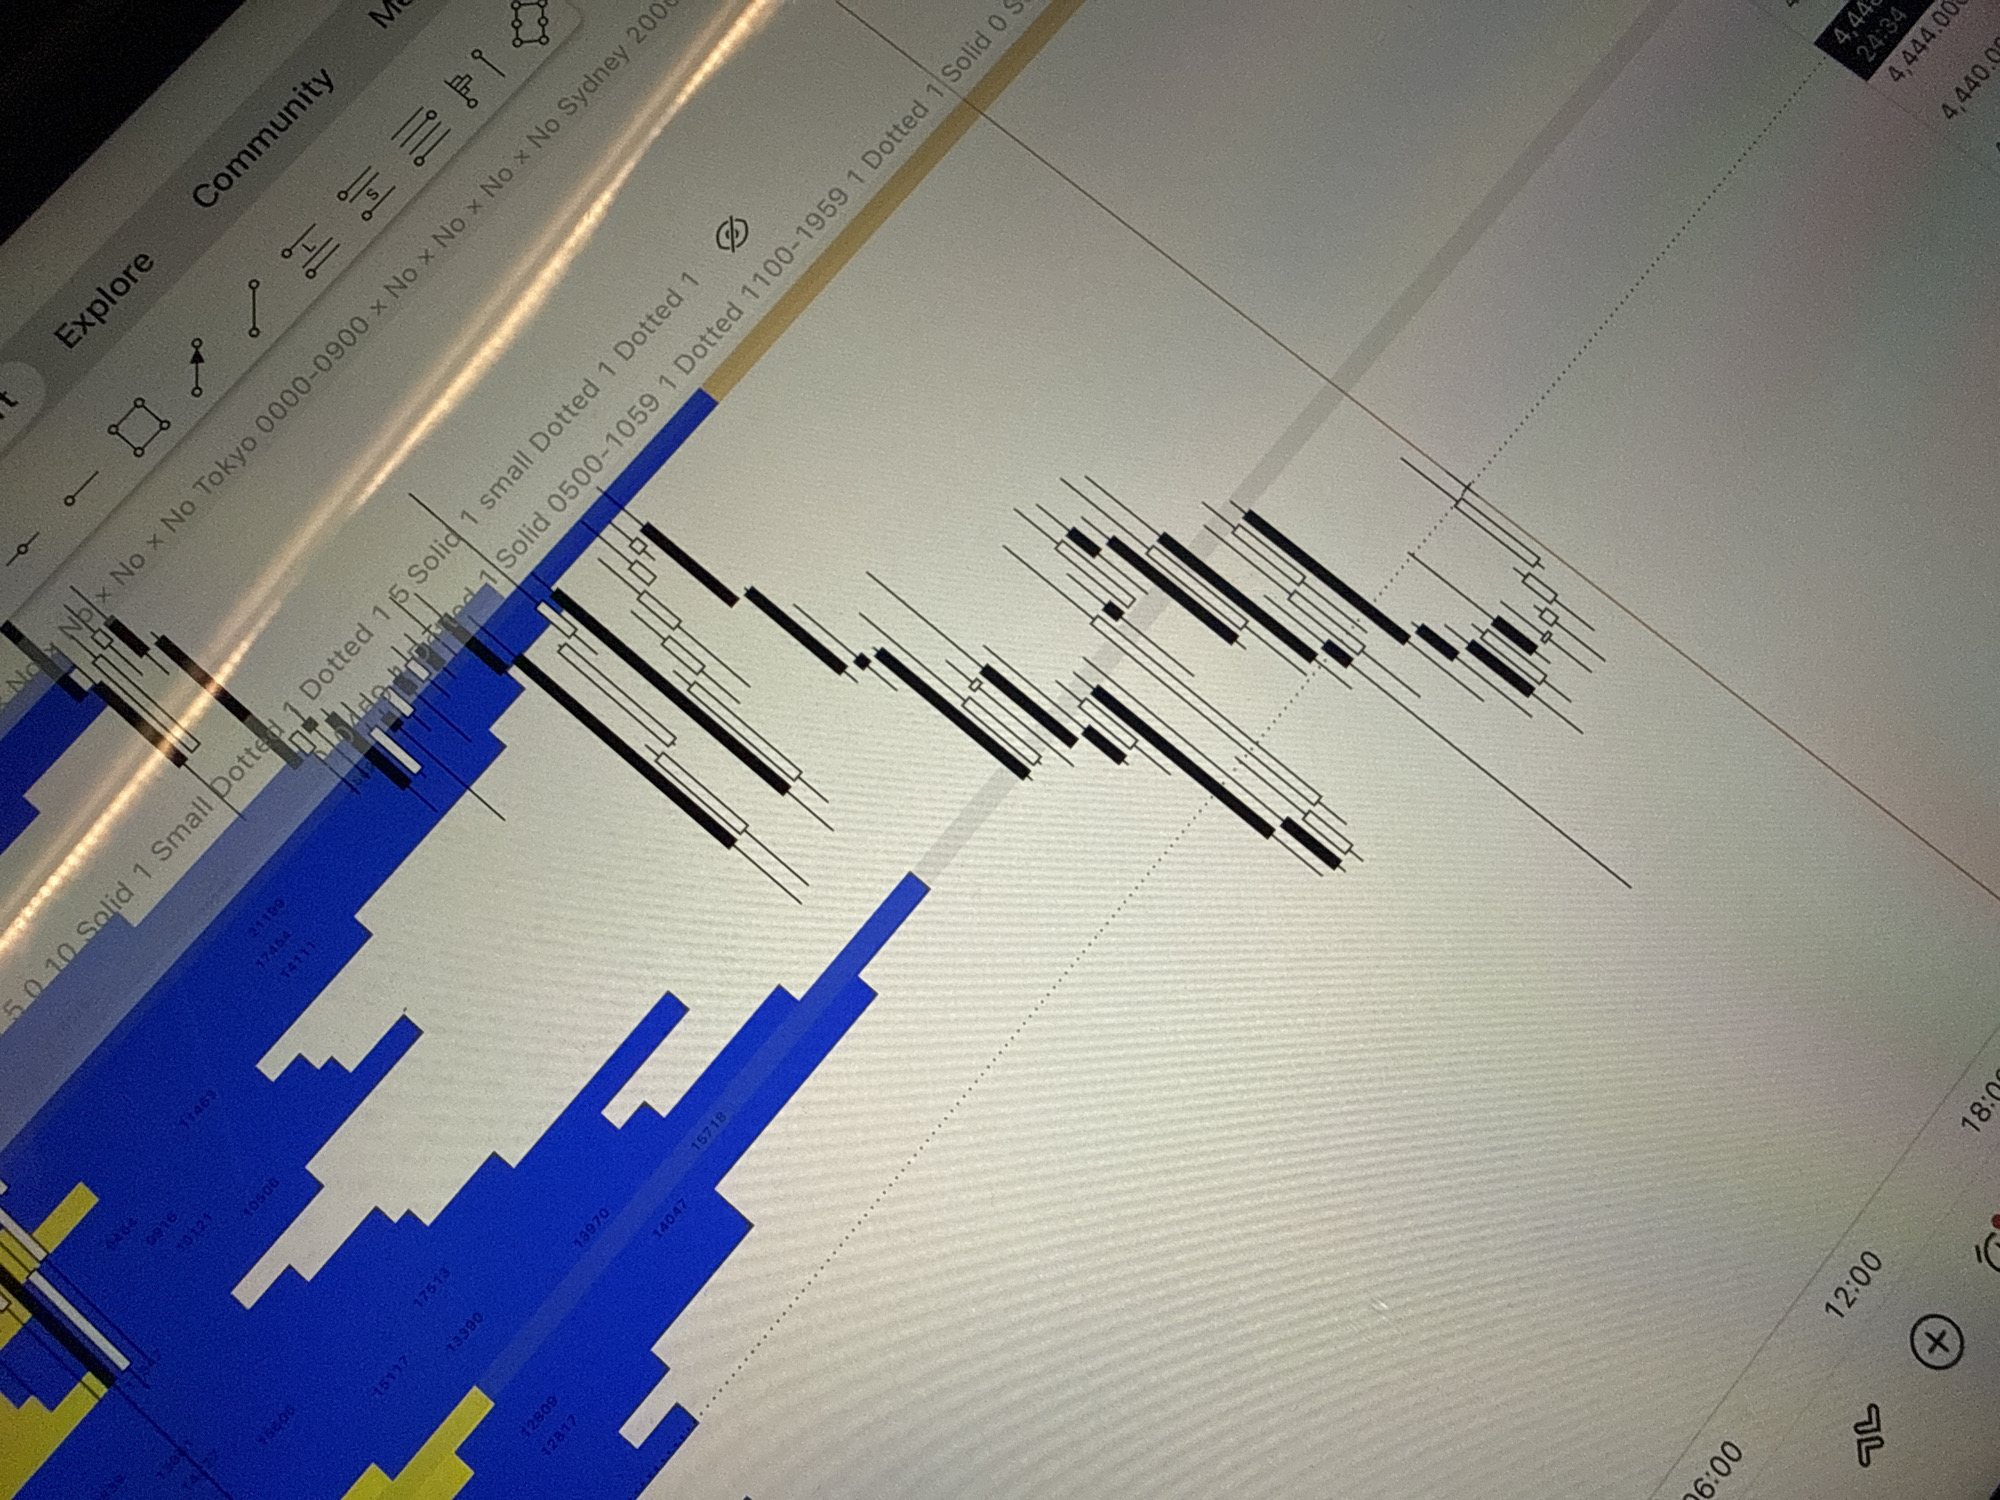
An angled shot captures a digital screen displaying financial charts, likely from a trading or market analysis platform. The primary subject is a candlestick chart, characterized by black and white vertical bars, spread across the central and right portions of the screen. To the left, a volume profile is depicted with blue and white/yellow horizontal bars, each labeled with numerical values such as "21199," "17454," "14111," and "15718." The screen's interface includes menu options like "Explore" and "Community" at the top left. Various icons representing tools or settings are visible alongside these, such as geometric shapes and line drawing indicators. A strong diagonal glare from an external light source cuts across the middle of the screen, partially obscuring some details. Text overlays on the chart indicate settings related to time zones or trading sessions, such as "No x No Tokyo 0000-0900" and "Solid 0500-1059 1 Dotted 1100-1959." The horizontal axis features time markers like "06:00," "12:00," and "18:00," while the vertical price axis on the top right shows values like "4,444.00" and "4,440.00," alongside a timestamp "24:34." The overall setting appears to be an indoor environment, possibly an office or personal workspace, illuminated by a bright light source.
Symbol
0694B
Volume
1
Creator
+$0.14
Revenue
+$0.00
TVL
$0.00