
Stake attention in this memory
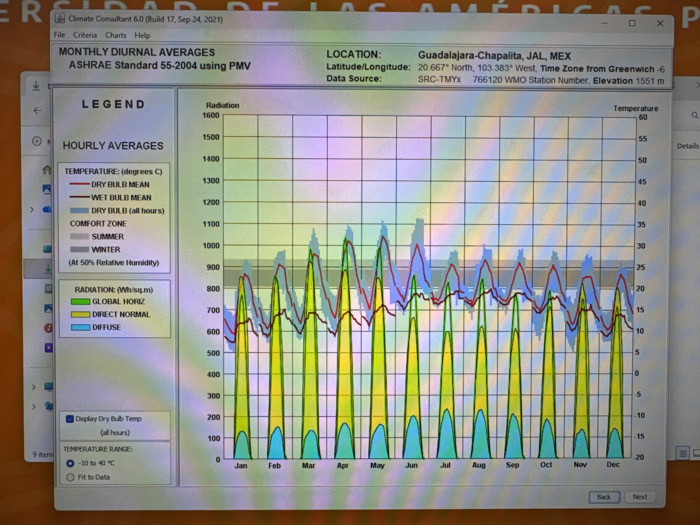
The image displays a computer screen showing the "Climate Consultant 6.0" software interface. The software, built on September 24, 2021, is presenting "MONTHLY DIURNAL AVERAGES" of climate data based on ASHRAE Standard 55-2004 using PMV (Predicted Mean Vote). The screen shows the location information for "Guadalajara-Chapalita, JAL, MEX" with coordinates 20.667° North, 103.383° West, a Time Zone from Greenwich -6, a Data Source of SRC-TMYX, WMO Station Number 766120, and an Elevation of 1551 m. A legend on the left panel details the graph's elements: * **HOURLY AVERAGES:** * **TEMPERATURE (degrees C):** Represented by a red line for "DRY BULB MEAN," a darker red/brown line for "WET BULB MEAN," and a light blue shaded area for "DRY BULB (all hours)." * **COMFORT ZONE (At 50% Relative Humidity):** Shaded areas labeled "SUMMER" (darker grey) and "WINTER" (lighter grey). * **RADIATION (Wh/sq.m):** Represented by stacked bars: "GLOBAL HORIZ" (green outline), "DIRECT NORMAL" (yellow), and "DIFFUSE" (light blue). Below the legend, there are options for displaying "Dry Bulb Temp (all hours)" (checked) and a "TEMPERATURE RANGE" of "-10 to 40 °C" (selected, with "Fit to Data" unselected). The main part of the screen is a large graph with months from January to December on the X-axis. It features two Y-axes: * The left Y-axis, ranging from 0 to 1600 in increments of 100, is for "Radiation" (Wh/sq.m). * The right Y-axis, ranging from -20 to 60 in increments of 5, is for "Temperature" (degrees C). The graph shows daily temperature fluctuations throughout the year, with the dry bulb mean temperature (red line) typically peaking during the day and dropping at night. The wet bulb mean temperature (darker red/brown line) consistently stays below the dry bulb mean. The light blue shaded area indicates the range of dry bulb temperatures throughout all hours. Comfort zones are overlaid on the temperature data. Below the temperature lines, stacked bar charts represent solar radiation. These bars show diurnal peaks for each month, with "DIRECT NORMAL" radiation (yellow) contributing the most to the total, followed by "GLOBAL HORIZ" (green outline) and "DIFFUSE" (light blue). Radiation values appear highest around April and May, reaching peaks close to 900 Wh/sq.m, and lowest in winter months. The overall scene suggests a climate analysis or architectural design context, likely in an academic or professional environment, given the partial text "ERSIDAD DE LAS AMERICAS P" visible in the background, possibly from a "Universidad de las Américas Puebla" banner or similar. The image itself is a photograph of a computer monitor, showing some reflections and glare. Navigation buttons "Back" and "Next" are visible at the bottom right.
Loading AttnAds…
No transactions found