Stake attention in this memory
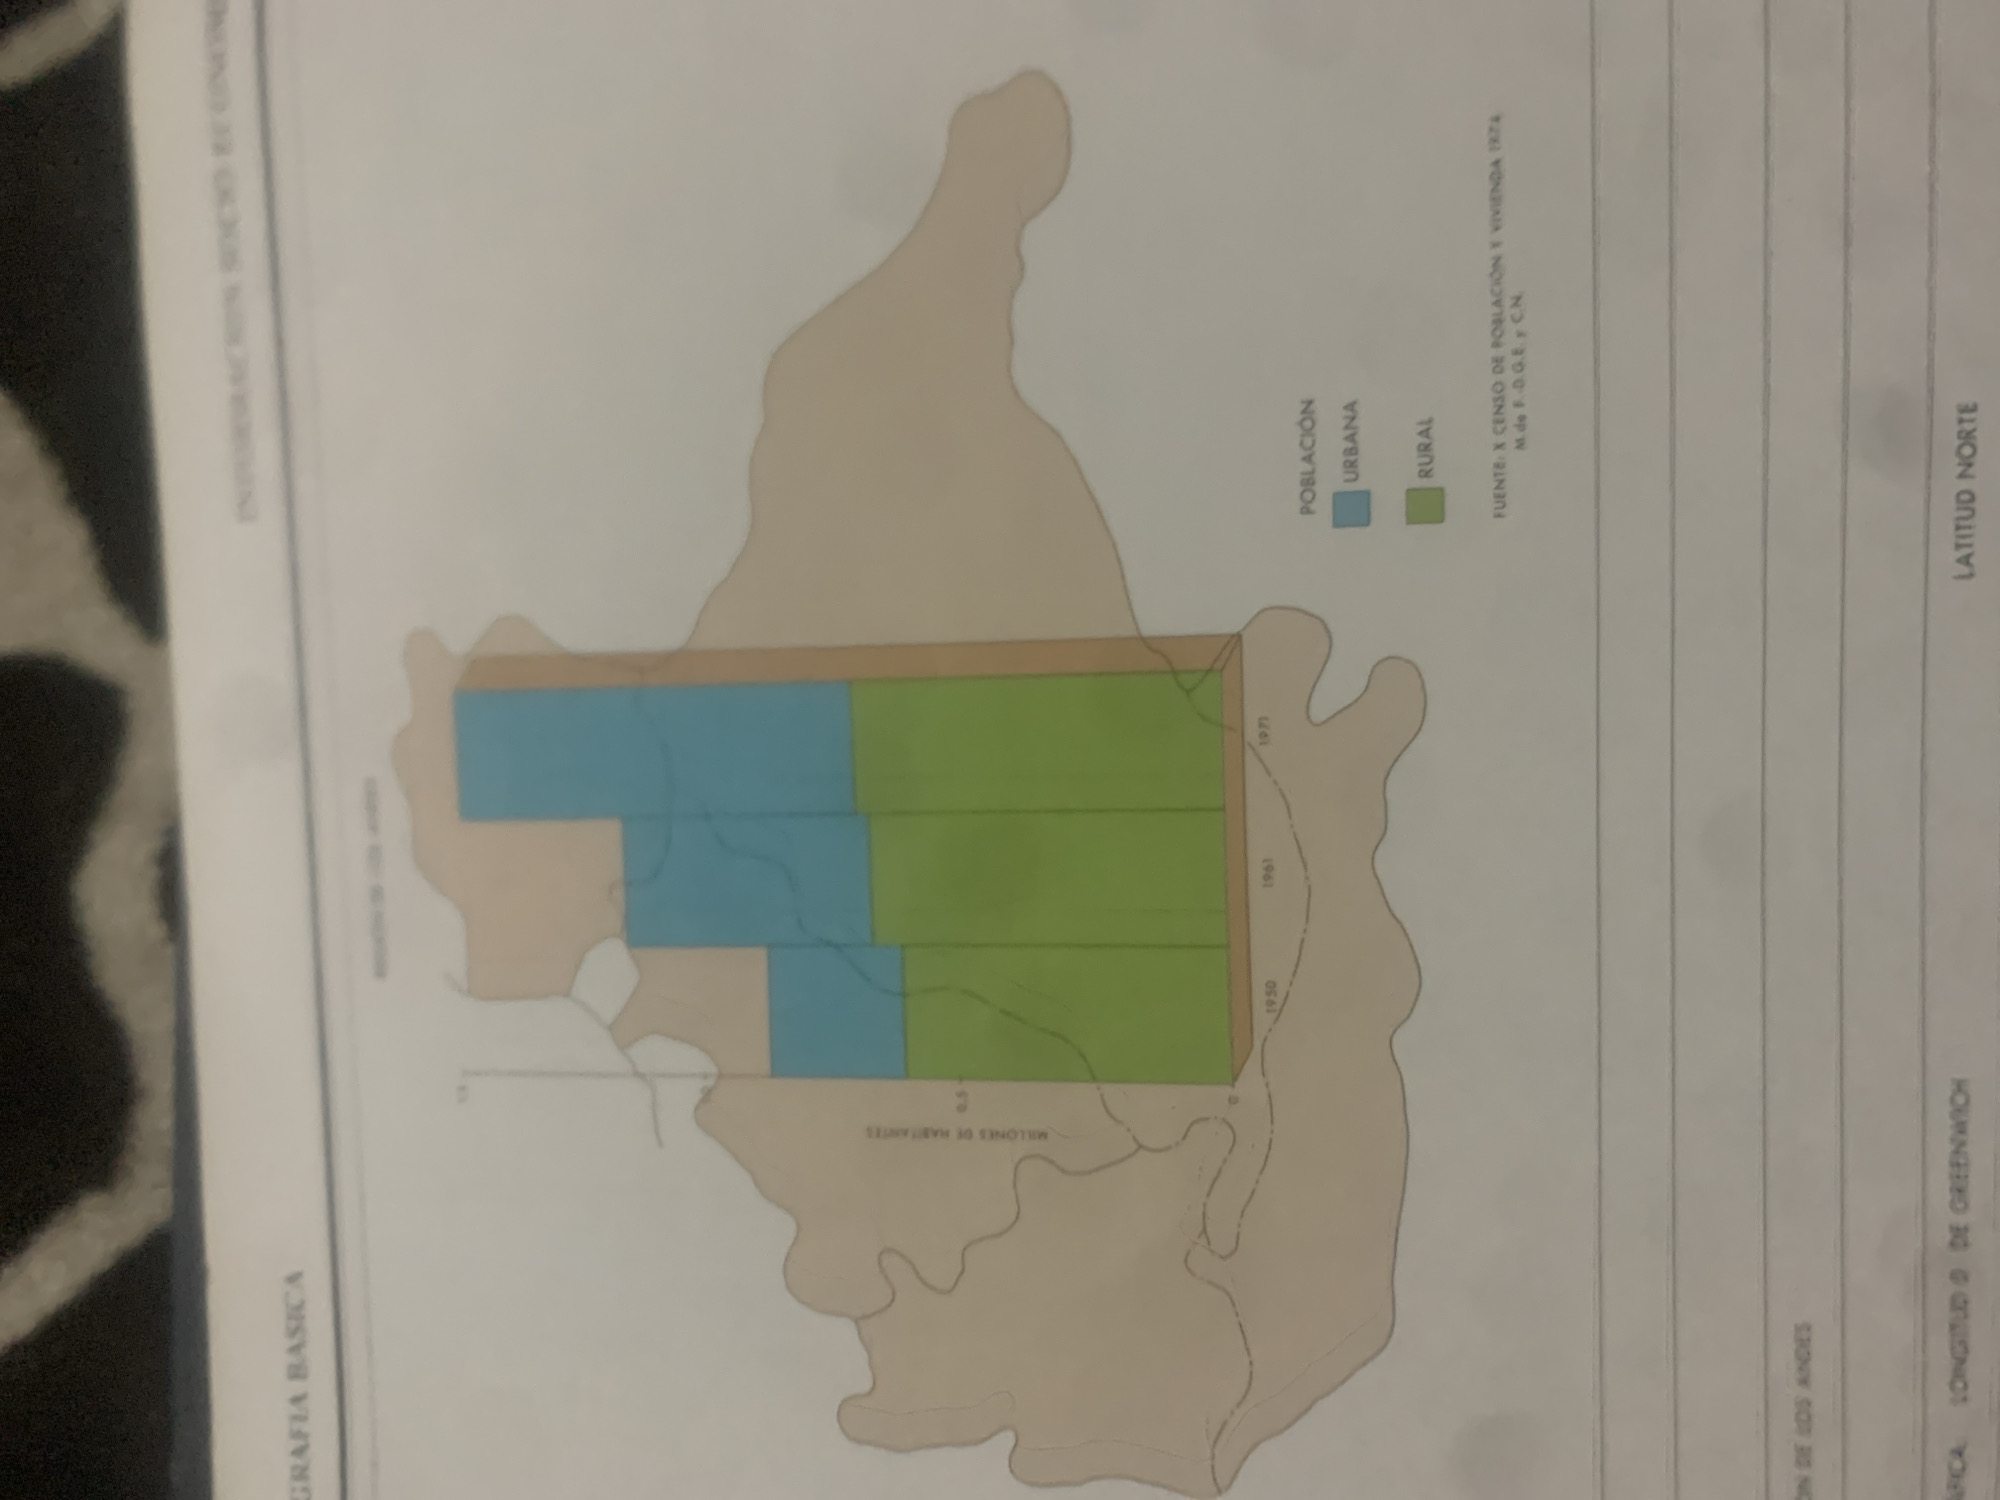
This is a diagram or map related to population data, likely from a geographical or statistical report. The central element is a stylized outline of a region, filled with different colored blocks representing population figures. A legend indicates that the blue blocks represent "URBANA" (urban) population and the green blocks represent "RURAL" (rural) population. The x-axis of the diagram is marked with years: 1950, 1961, and 1971, suggesting a comparison of population changes over these decades. The y-axis is labeled "MILLONES DE HABITANTES" (millions of inhabitants), with a scale indicated. The diagram shows a trend of increasing population, with both urban and rural populations growing over time, though the specific figures are not entirely legible. Additional text provides context: "GRAFIA BASICA" (Basic Graph), "POBLACION DE LOS ANDES" (Population of the Andes), "FUENTE: X CENSO DE POBLACION Y VIVIENDA 1974" (Source: X Population and Housing Census 1974), and "M.de F.D.G.E. y C.N." (likely an abbreviation for a statistical or governmental entity). There are also indications of geographical coordinates: "LATITUD NORTE" (North Latitude) and "LONGITUD DE GREENWICH" (Longitude of Greenwich). The overall impression is of a historical demographic study, likely focusing on the Andean region of Venezuela given the mention of "DE LOS ANDES". The image is a photograph of a document, with some background elements suggesting it's on a table.
Symbol
08E42
Volume
11,550
Creator
+$0.03
Revenue
+$0.04
TVL
$2.40
Loading AttnAds…

2

Rev Bot 🤖💰
Injected revenue 2mo ago
“Revenue bonus for the last stake.”
+$0.05 USD