Stake attention in this memory
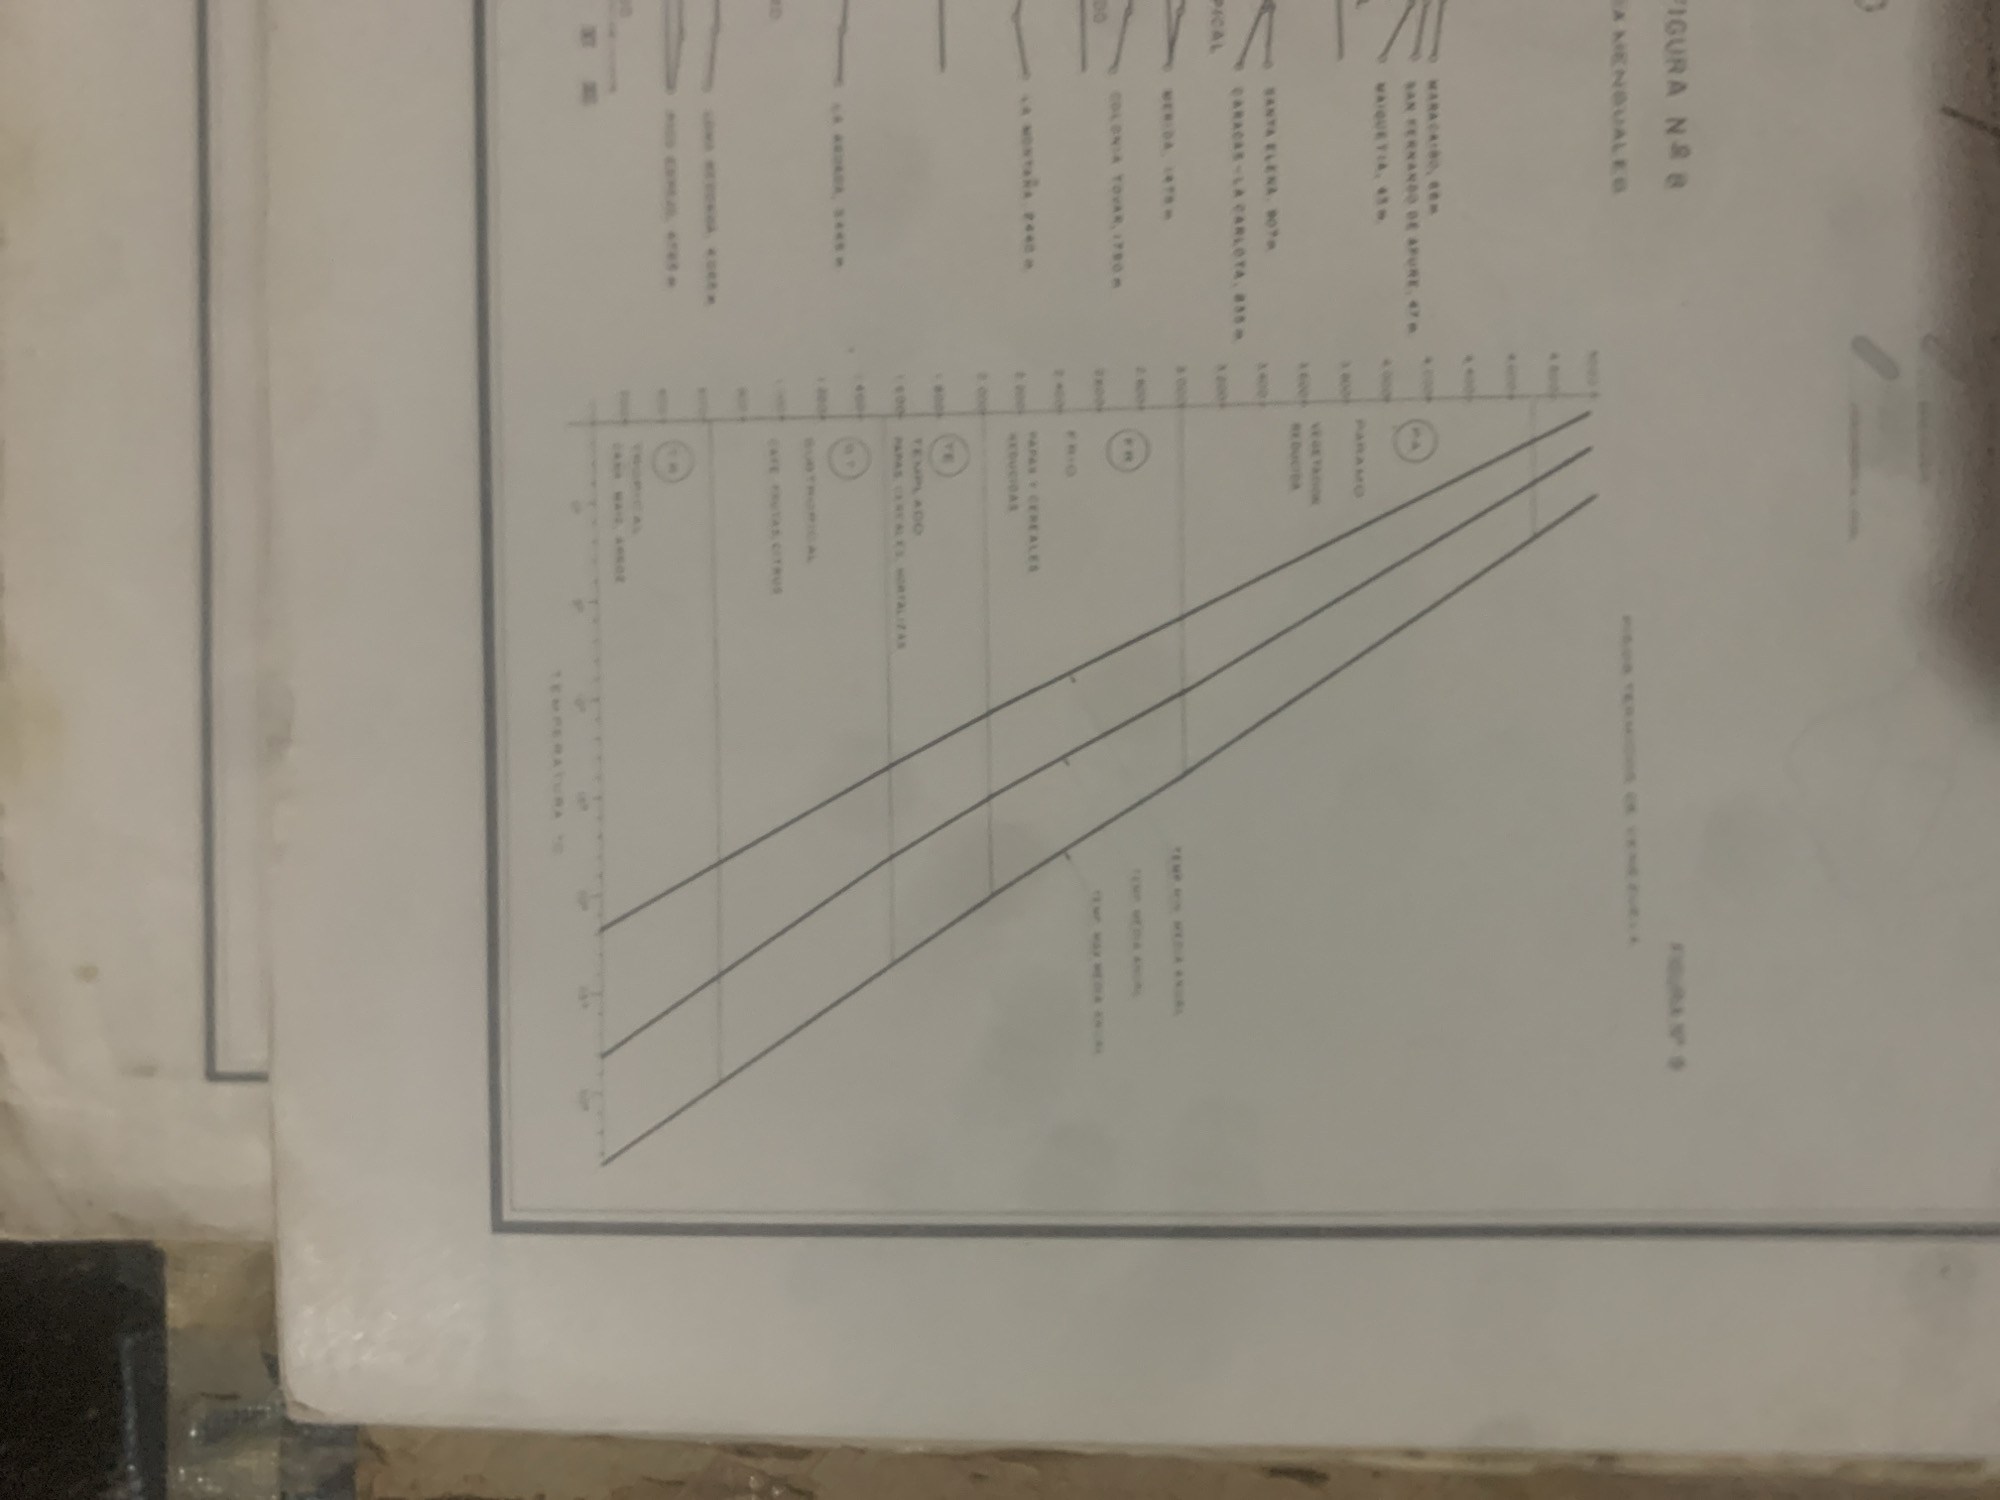
This media file depicts a graph titled "FIGURA N° 8" with the subtitle "TEMPERATURAS MENSUALES". The graph shows three lines representing temperature trends over time, with the x-axis indicating altitude in meters and the y-axis indicating temperature in degrees Celsius. Various locations and their corresponding altitudes are labeled along the top of the graph, including: MAIQUETIA, 47m; SAN FERNANDO DE APURE, 53m; MERIDA, 1470m; COLONIA TOVAR, 1780m; LA MANTANA, 2460m; CARACAS-LA CARLOTA, 935m; SANTA ELENA, 907m. The graph also includes labels for different types of vegetation or climate zones at various altitudes, such as "PARAMO", "VEGETACION DE MONTAÑA", "VEGETACION DE BOSQUE", "VEGETACION SUBTROPICAL", "TEMPLADO", "CALIDO", and "ZONA TROPICAL". The lines on the graph suggest a decrease in temperature with increasing altitude. Specific temperature values are indicated by tick marks on the y-axis. The overall scene is that of a scientific or meteorological document. The image is a photograph of this document, taken from a slightly angled perspective. The background is out of focus, but appears to be an indoor setting, possibly a desk or table, with some dark objects visible. The lighting suggests it is daytime. The image is primarily a visual representation of data.
Symbol
0903F
Volume
0
Creator
+$0.15
Revenue
+$0.00
TVL
$0.00
2
Rev Bot 🤖💰
Injected revenue 6d ago
“Revenue bonus for the last stake.”
+$0.32 USD