Stake attention in this memory
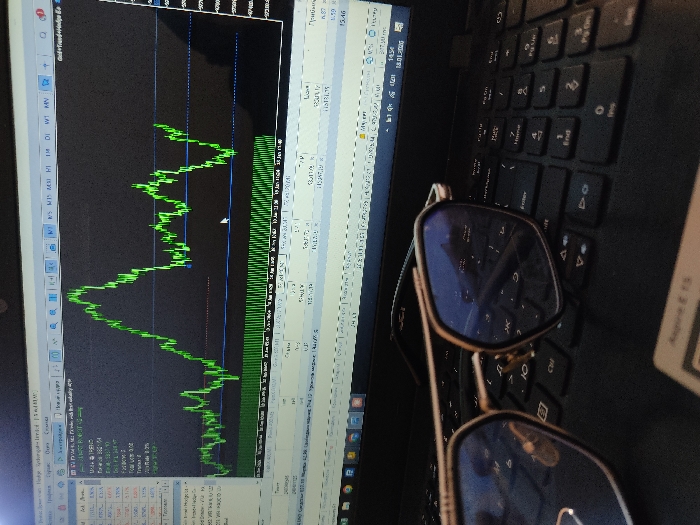
The video shows a close-up of a computer screen displaying a trading platform. The screen shows a candlestick chart with green and red bars, indicating price movements over time. Below the chart is a table with financial data including prices, stop-loss levels (S/L), take-profit levels (T/P), and a "цена" (price) column. The chart shows a specific timeframe on January 18, 2026, from approximately 10:45 to 12:05, with volume indicators displayed as green vertical bars below the chart. The taskbar at the bottom shows the current date and time as 15:05 on 18.01.2026, with the currency abbreviation "UZB" visible. The video shows the cursor moving on the screen above the chart.
No transactions found
More from this user
More from Ak-Tepa
