Stake attention in this memory
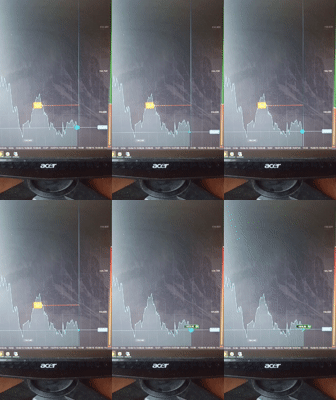
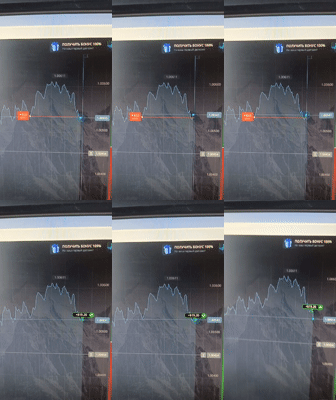
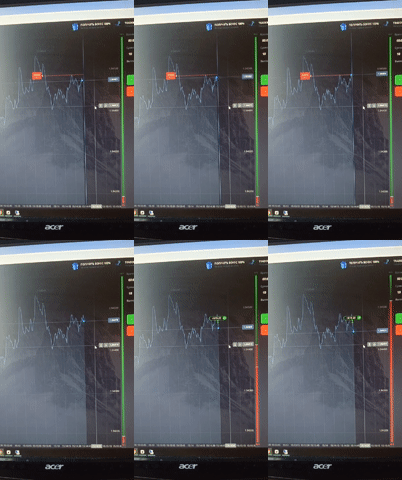
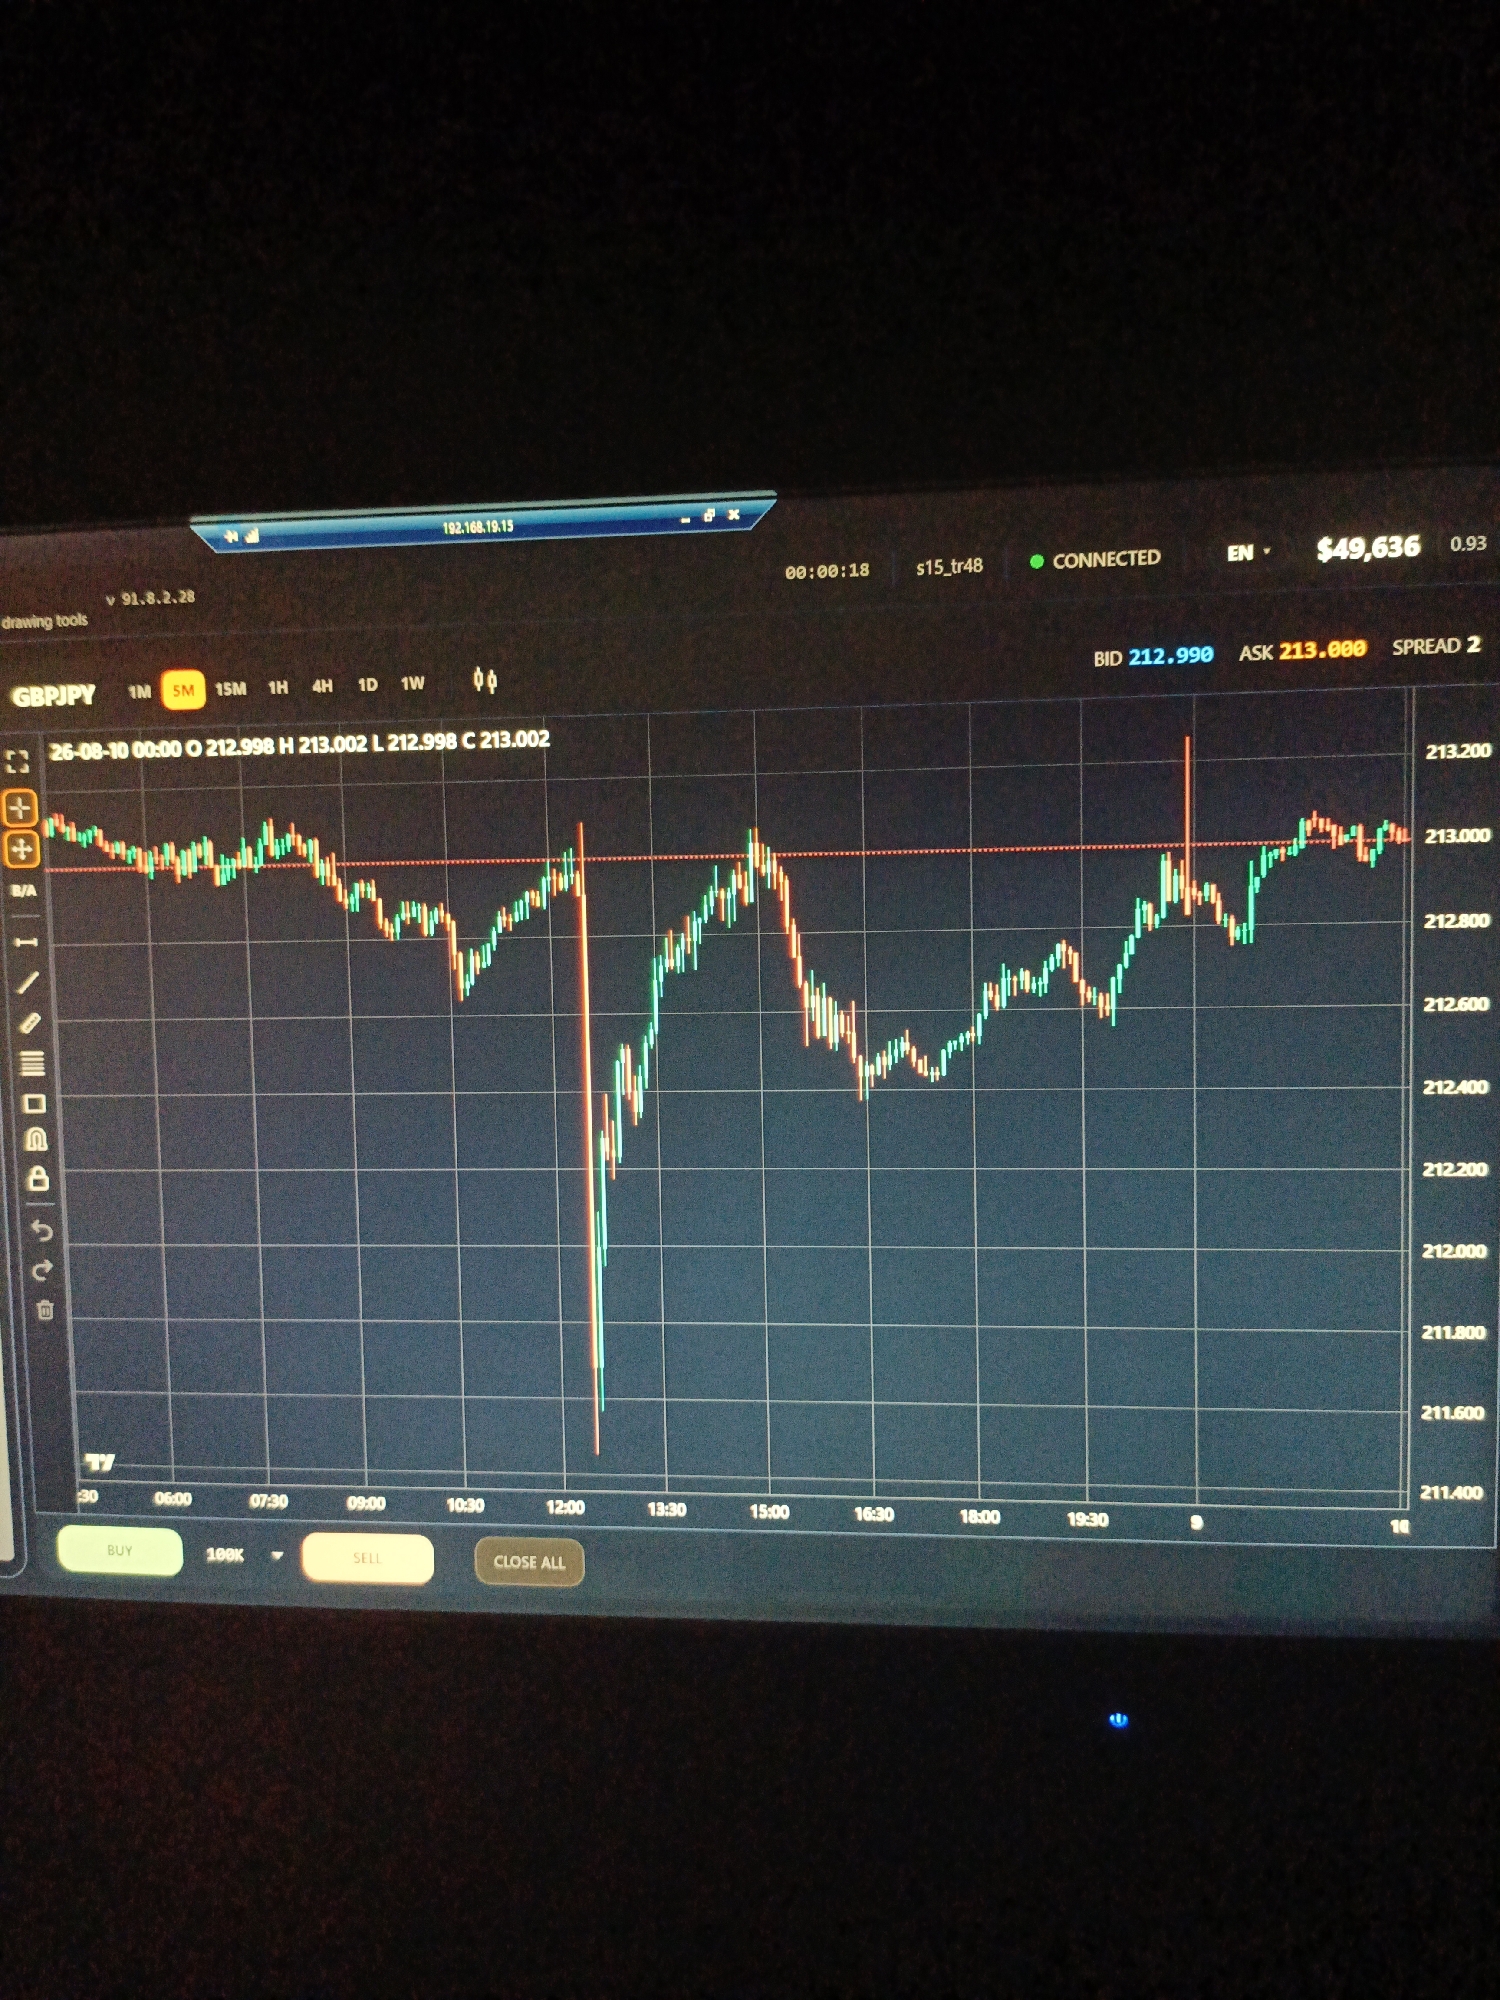
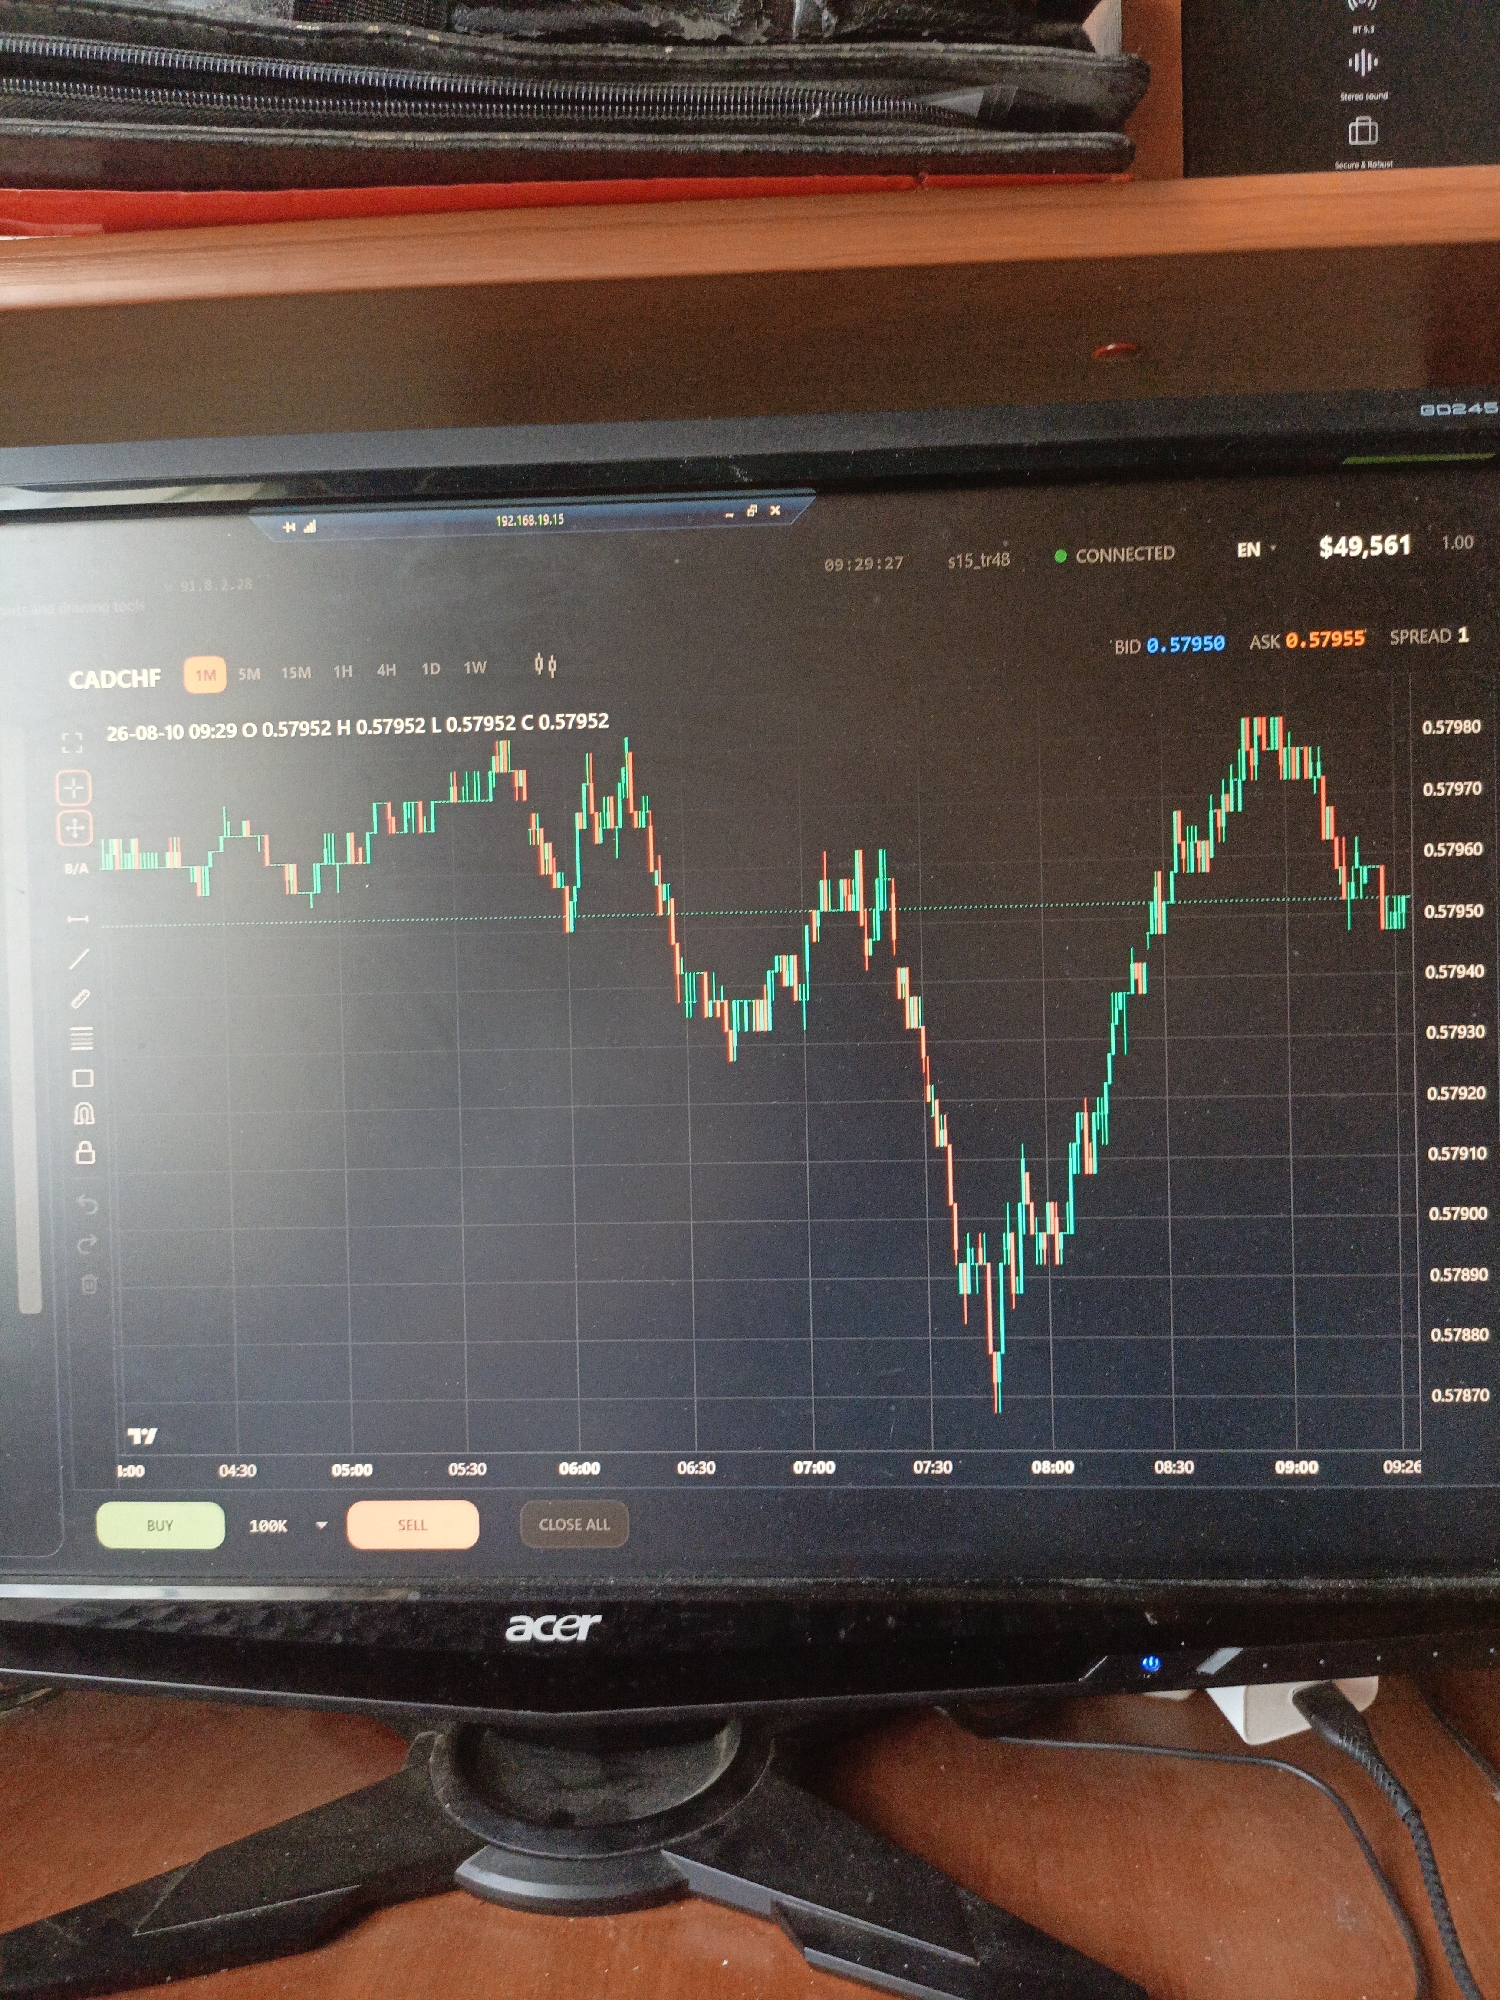
The video shows a computer screen displaying a financial trading chart. A blue line represents the fluctuating price of an asset over time, with timestamps visible on the horizontal axis. Several markers and labels are present on the chart, indicating specific price points and potentially trade orders. One marker, labeled "+$10", is highlighted in orange. Another marker, labeled "+$19.20", is highlighted in green, and appears to be a recent price point. The vertical axis displays price values. The chart appears to be showing a downward trend in the asset's price, with a recent uptick. The computer monitor is partially visible, along with a desk surface below. The overall environment is likely an office or home setting where a computer is being used for trading.
Loading AttnAds…
No transactions found