Stake attention in this memory
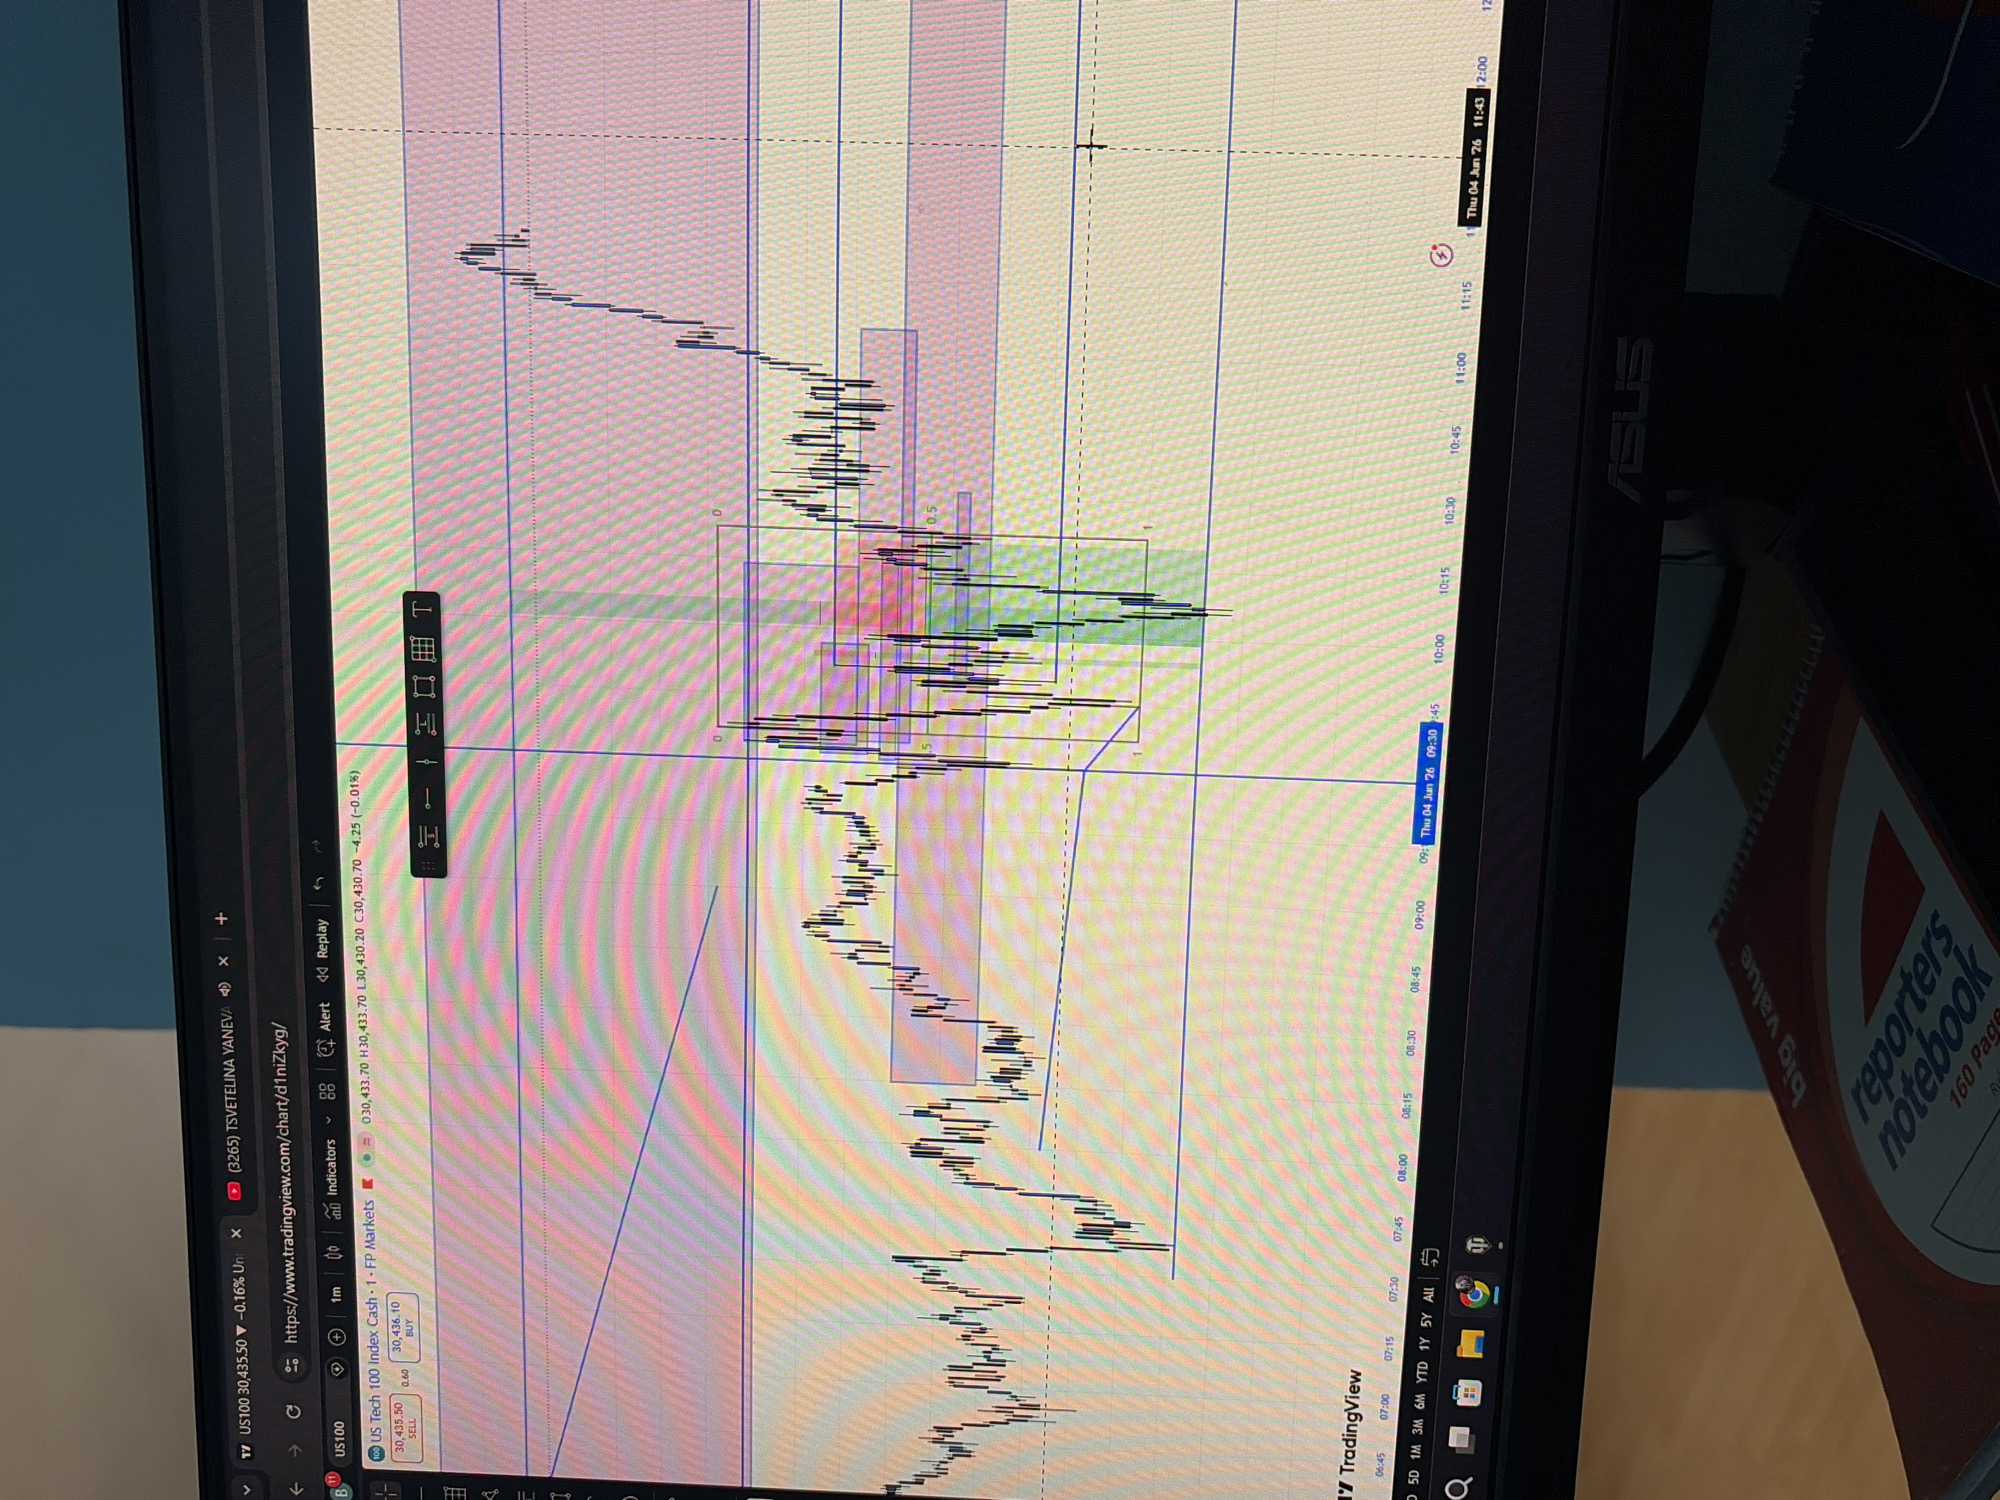
An ASUS laptop screen displays a financial trading chart, likely from TradingView, showing price movements for the "US Tech 100 Index Cash" (US100). The chart is a candlestick graph set to a 1-minute (1m) timeframe, indicating detailed short-term market analysis. Various technical analysis tools are visible, including horizontal and vertical lines, and shaded rectangular zones (red, green, purple) that delineate specific trading areas or time periods. The chart data shows the instrument US100 at 30,435.50, down 0.16%. Specific price details visible are O30,433.70, H30,433.70, L30,430.20, C30,430.70, with a change of -4.25 (-0.01%). "BUY" and "SELL" buttons are shown with prices 30,436.10 and 30,435.50 respectively. The timeline at the bottom indicates a date of "Thu 04 Jun 26" with time ranging from approximately 06:45 to 12:00, with the current view at 11:43, suggesting a historical replay or simulation. To the right of the laptop, part of a "reporters notebook" with "160 Page" and "big value" text is visible on a desk surface. The laptop's bezel features the "ASUS" logo. The scene appears to be an indoor workstation, likely for financial analysis or trading. Other visible text includes "https://www.tradingview.com/chart/d1niZkyg/", "Indicators", "Alert", and "Replay" buttons on the interface.
Symbol
1E5D2
Volume
2,555
Creator
+$0.00
Revenue
+$0.00
TVL
$0.19
Loading AttnAds…
2
Rev Bot 🤖💰
Injected revenue 1mo ago
“Revenue bonus for the last stake.”
+$0.01 USD