
Stake attention in this memory
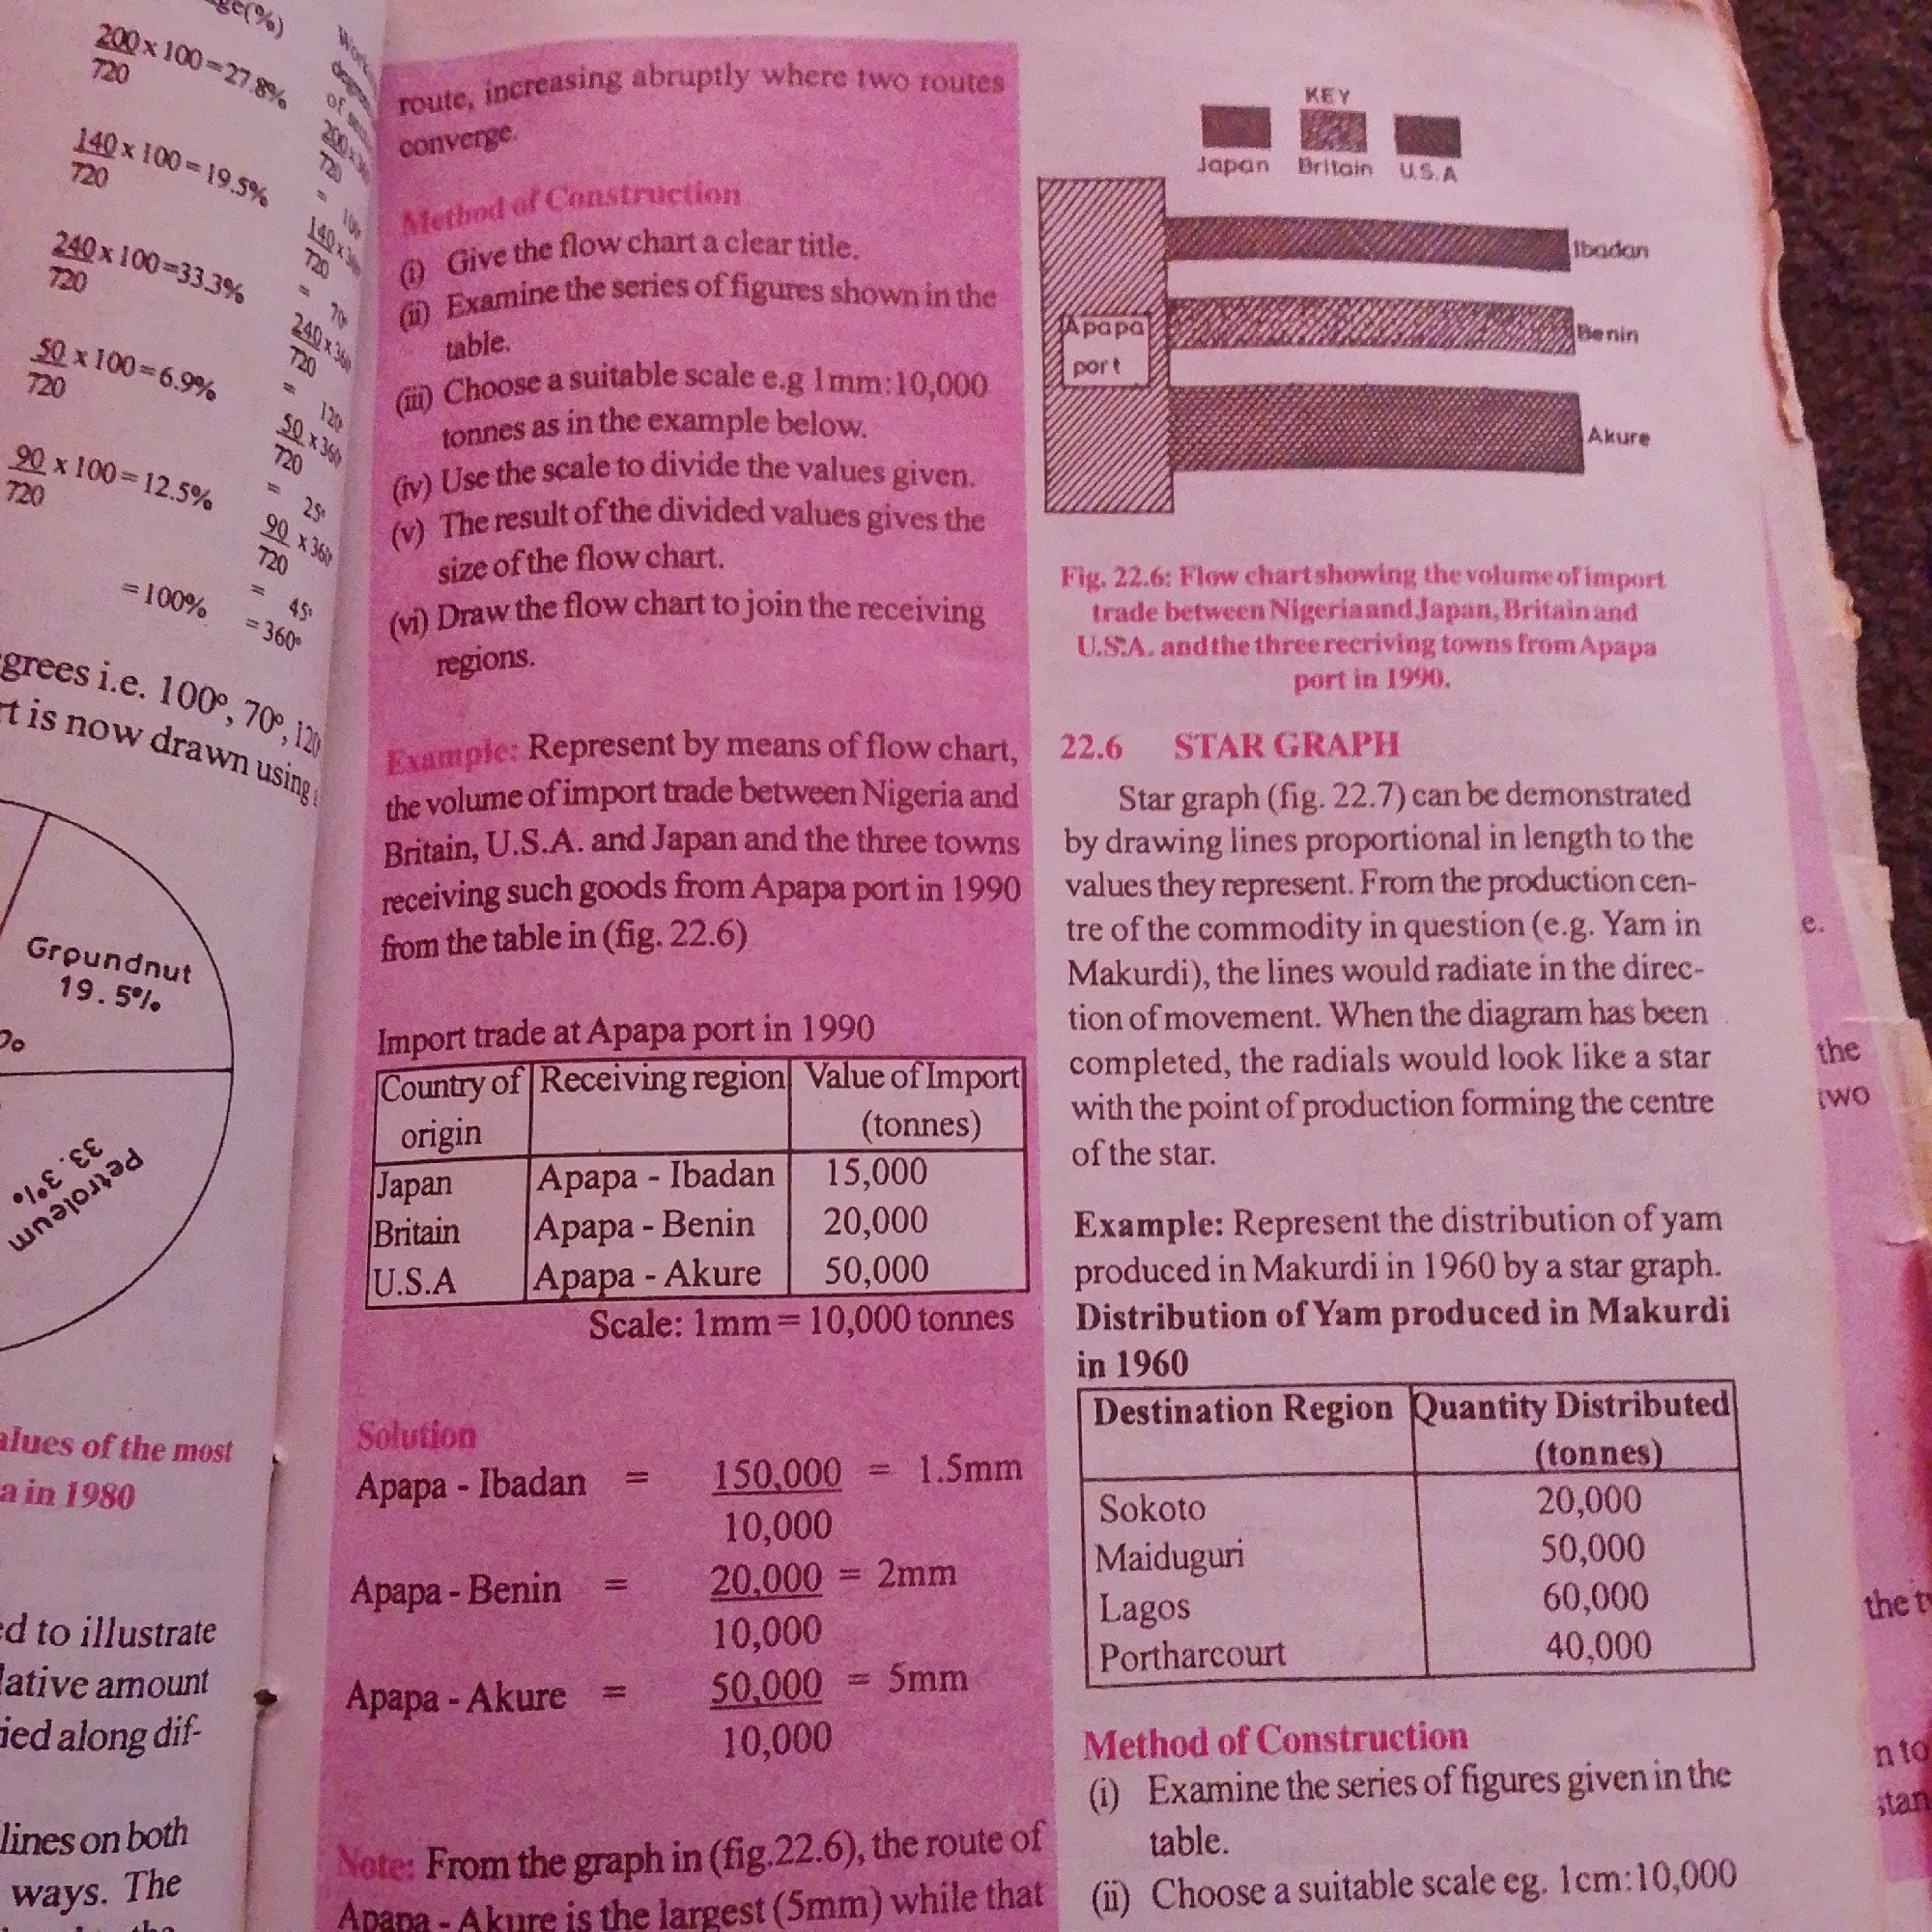
This media file is a close-up, slightly angled photograph of an open textbook or workbook page, likely from a geography or economics class. The page is filled with text, diagrams, and tables related to data representation and trade. The primary subject matter is educational content. On the left side, there's a pie chart showing percentages for "Groundnut" and "Petroleum," indicating proportions of something, possibly related to trade or resources in 1980. Adjacent to this are calculations with fractions, suggesting the conversion of percentages or quantities into degrees for the pie chart. The central and right portions of the page are dominated by text explaining methods of constructing charts, specifically flow charts and star graphs. There are also tables presenting data on "Import trade at Apapa port in 1990" and "Distribution of Yam produced in Makurdi in 1960." A flow chart diagram is also present, visually representing trade routes. Visible text includes titles, headings, instructions, data points, and captions. Some examples include "Method of Construction," "Example: Represent by means of flow chart," "Import trade at Apapa port in 1990," "Star Graph," "Distribution of Yam produced in Makurdi in 1960," and specific figures like "15,000," "20,000," "50,000," and percentages like "19.5%." The scene is static and educational, with no people or clear environmental cues beyond the context of a book. The lighting appears to be from an overhead source, possibly a classroom or study environment. There are no indicators of time of day, weather, or discernible emotions. The location context is provided as Jalingo, Nigeria, which is relevant to the specific trade and production data presented in the tables and diagrams.
Symbol
1E8AE
Volume
4,030
Creator
+$0.00
Revenue
+$0.01
TVL
$0.38
Loading AttnAds…

2

Rev Bot 🤖💰
Injected revenue 1mo ago
“Revenue bonus for the last stake.”
+$0.01 USD