Stake attention in this memory
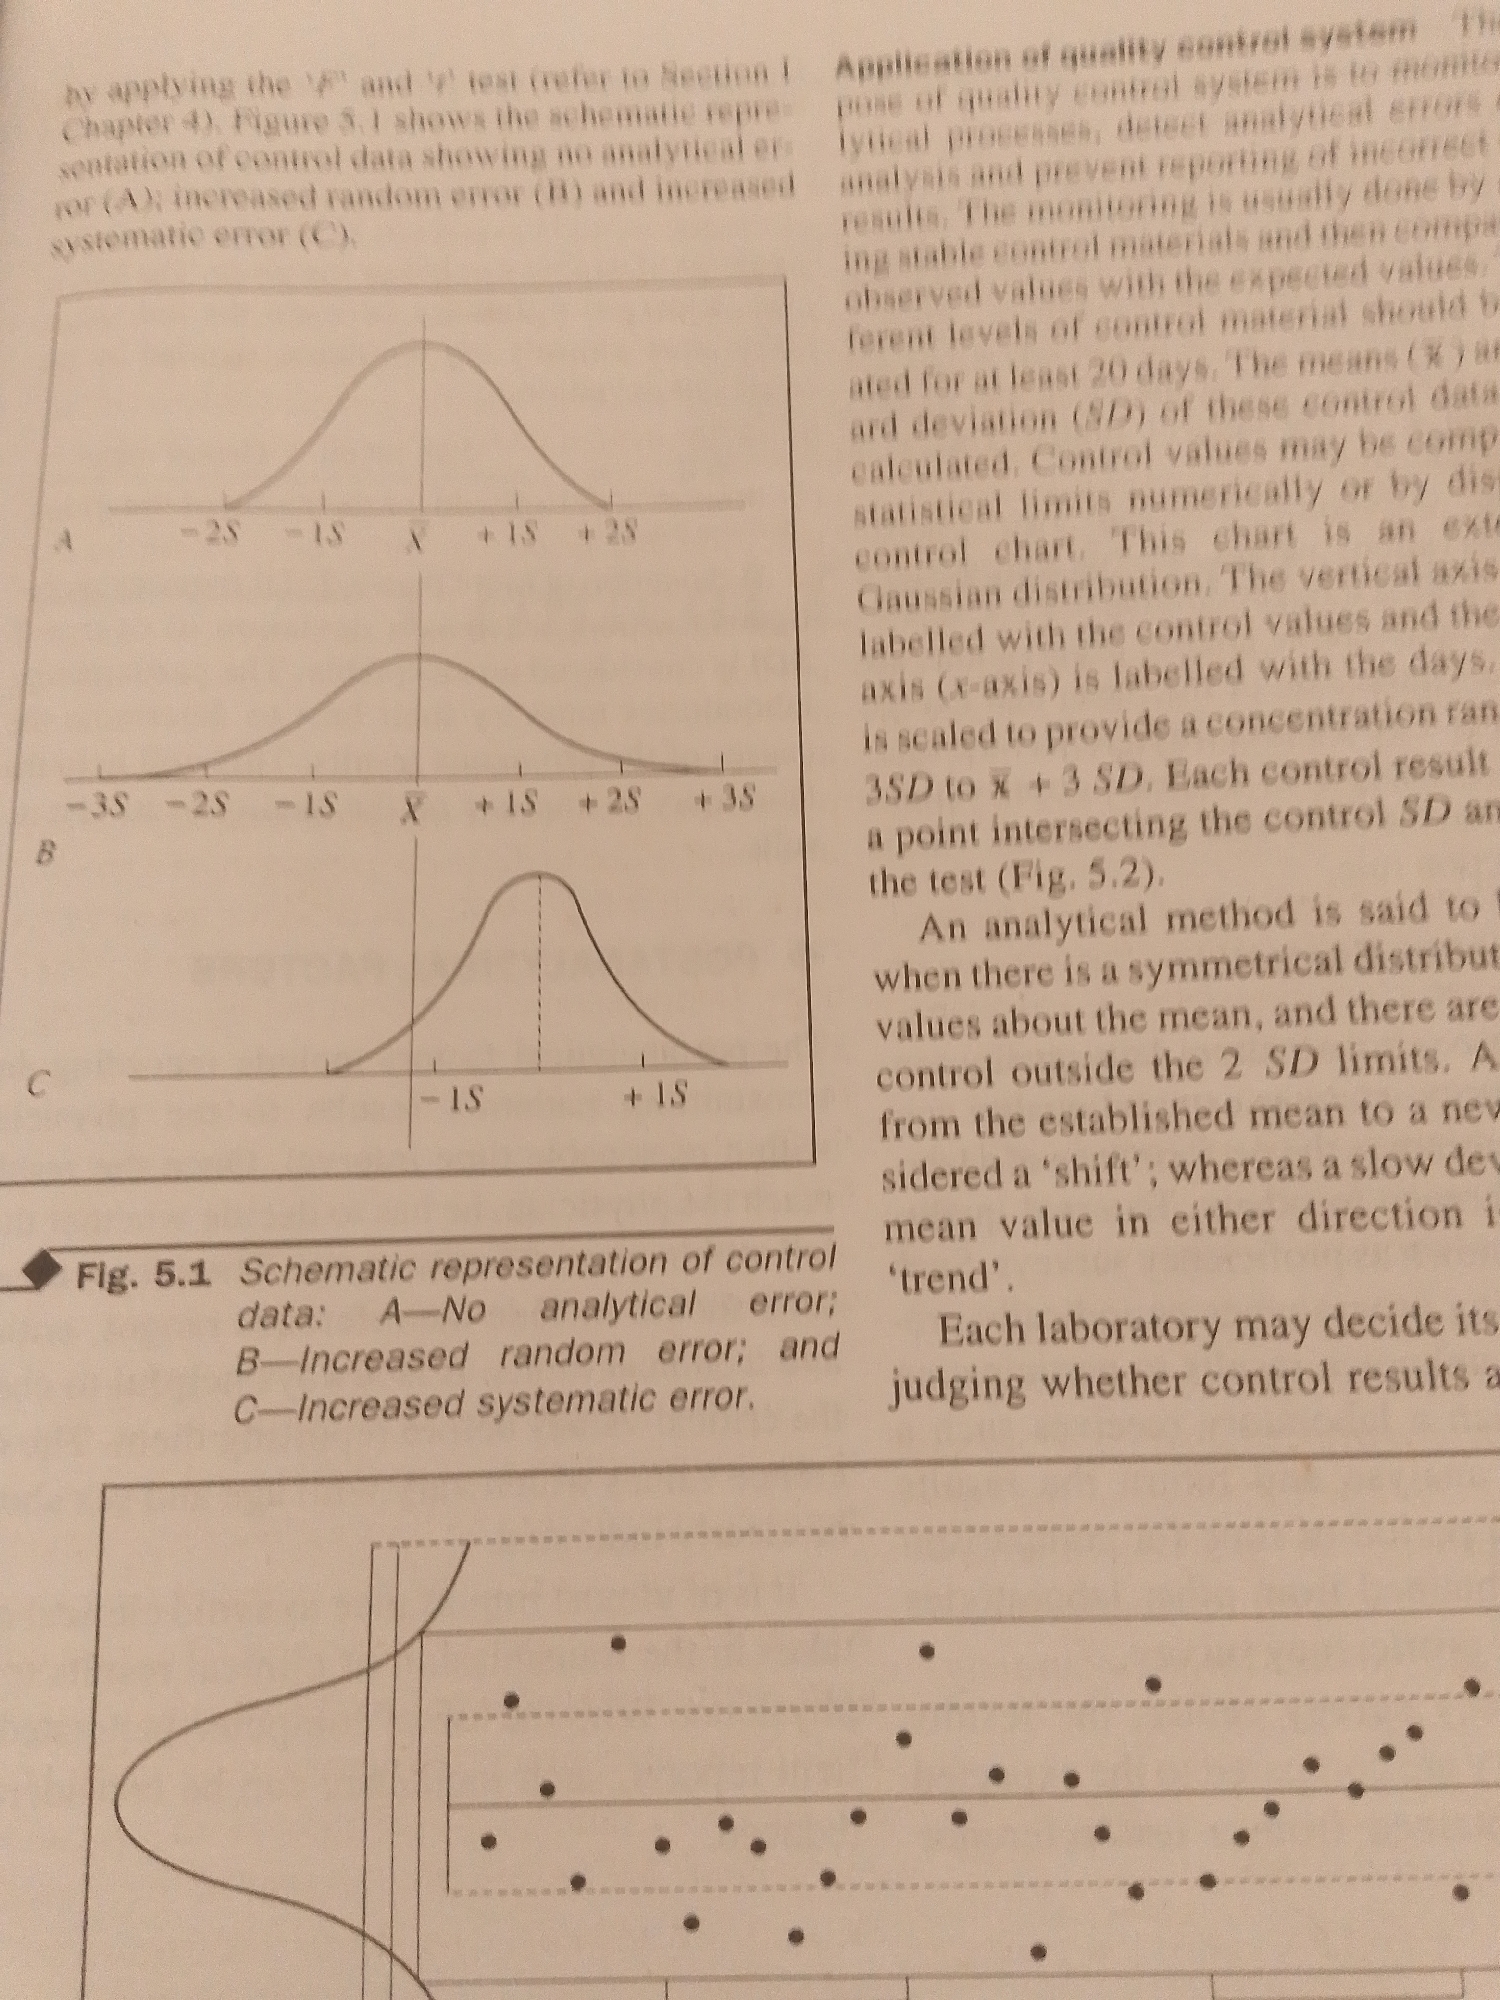
The image displays a page from a textbook or academic paper, focusing on the application of quality control systems in analytical processes. The primary visual elements are three schematic representations of control data distributions, labeled A, B, and C, illustrating concepts like "no analytical error," "increased random error," and "increased systematic error." Each distribution is plotted on a graph with axes representing standard deviations (S) and the mean (X). The accompanying text explains the purpose of quality control, how it's monitored, and the interpretation of control charts. It details how means and standard deviations are calculated and how control values are compared to statistical limits. The text also defines terms like "shift" and "trend" in the context of analytical method performance. Additionally, there is a section of text on the right side of the page discussing the "Application of quality control system." A portion of a control chart, showing individual data points plotted over time against control limits, is visible at the bottom of the image. The overall setting appears to be an academic or technical context, likely related to laboratory science, chemistry, or a similar field. There are no people or specific location cues to suggest Jalingo, Nigeria, or any particular time of day or weather. The focus is entirely on the technical diagrams and explanatory text.
No transactions found