
Stake attention in this memory
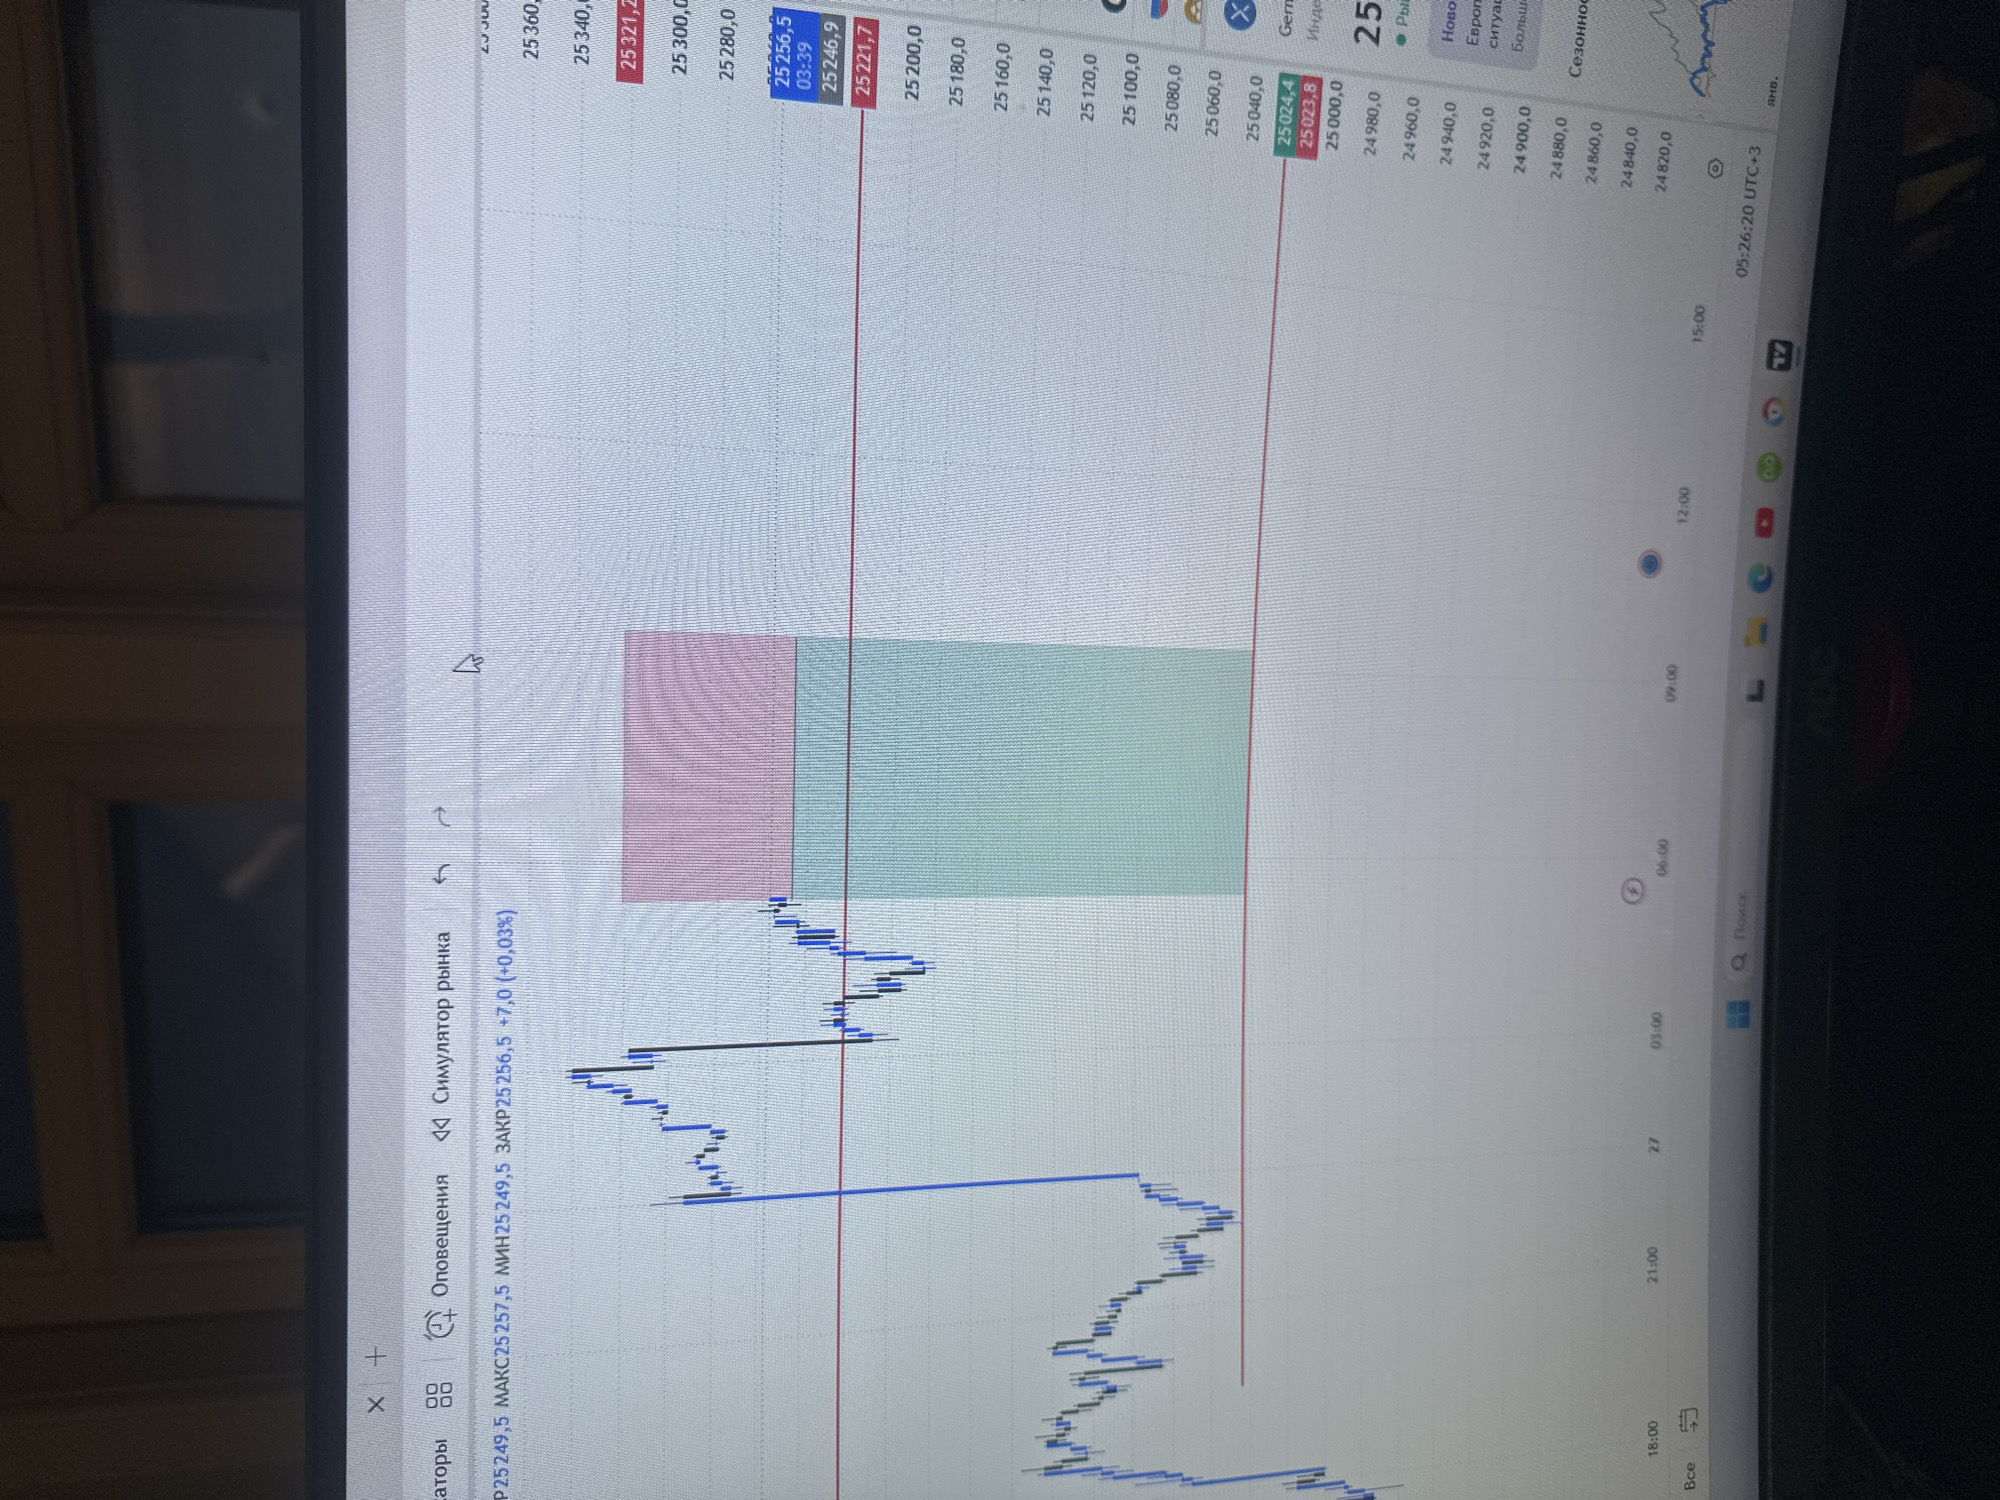
The image shows a computer monitor displaying a financial trading chart. The chart appears to be a candlestick chart, with blue and black lines representing price movements over time. There are also horizontal red lines and a shaded green and pink area that likely indicate trading zones or targets. The time axis at the bottom shows times like 18:00, 21:00, 03:00, and 06:00, suggesting it's a chart of intraday trading activity. The price axis on the right side displays numerical values ranging from approximately 24,800.0 to 25,360.0. At the top of the screen, there are interface elements that suggest a trading platform or financial software, including options like "Оповещения" (Alerts) and "Симулятор рынка" (Market Simulator). The scene is indoors, with a glimpse of a window with blinds in the background, suggesting a typical home or office environment. There are no people visible in the image.
Loading AttnAds…
No transactions found