Stake attention in this memory
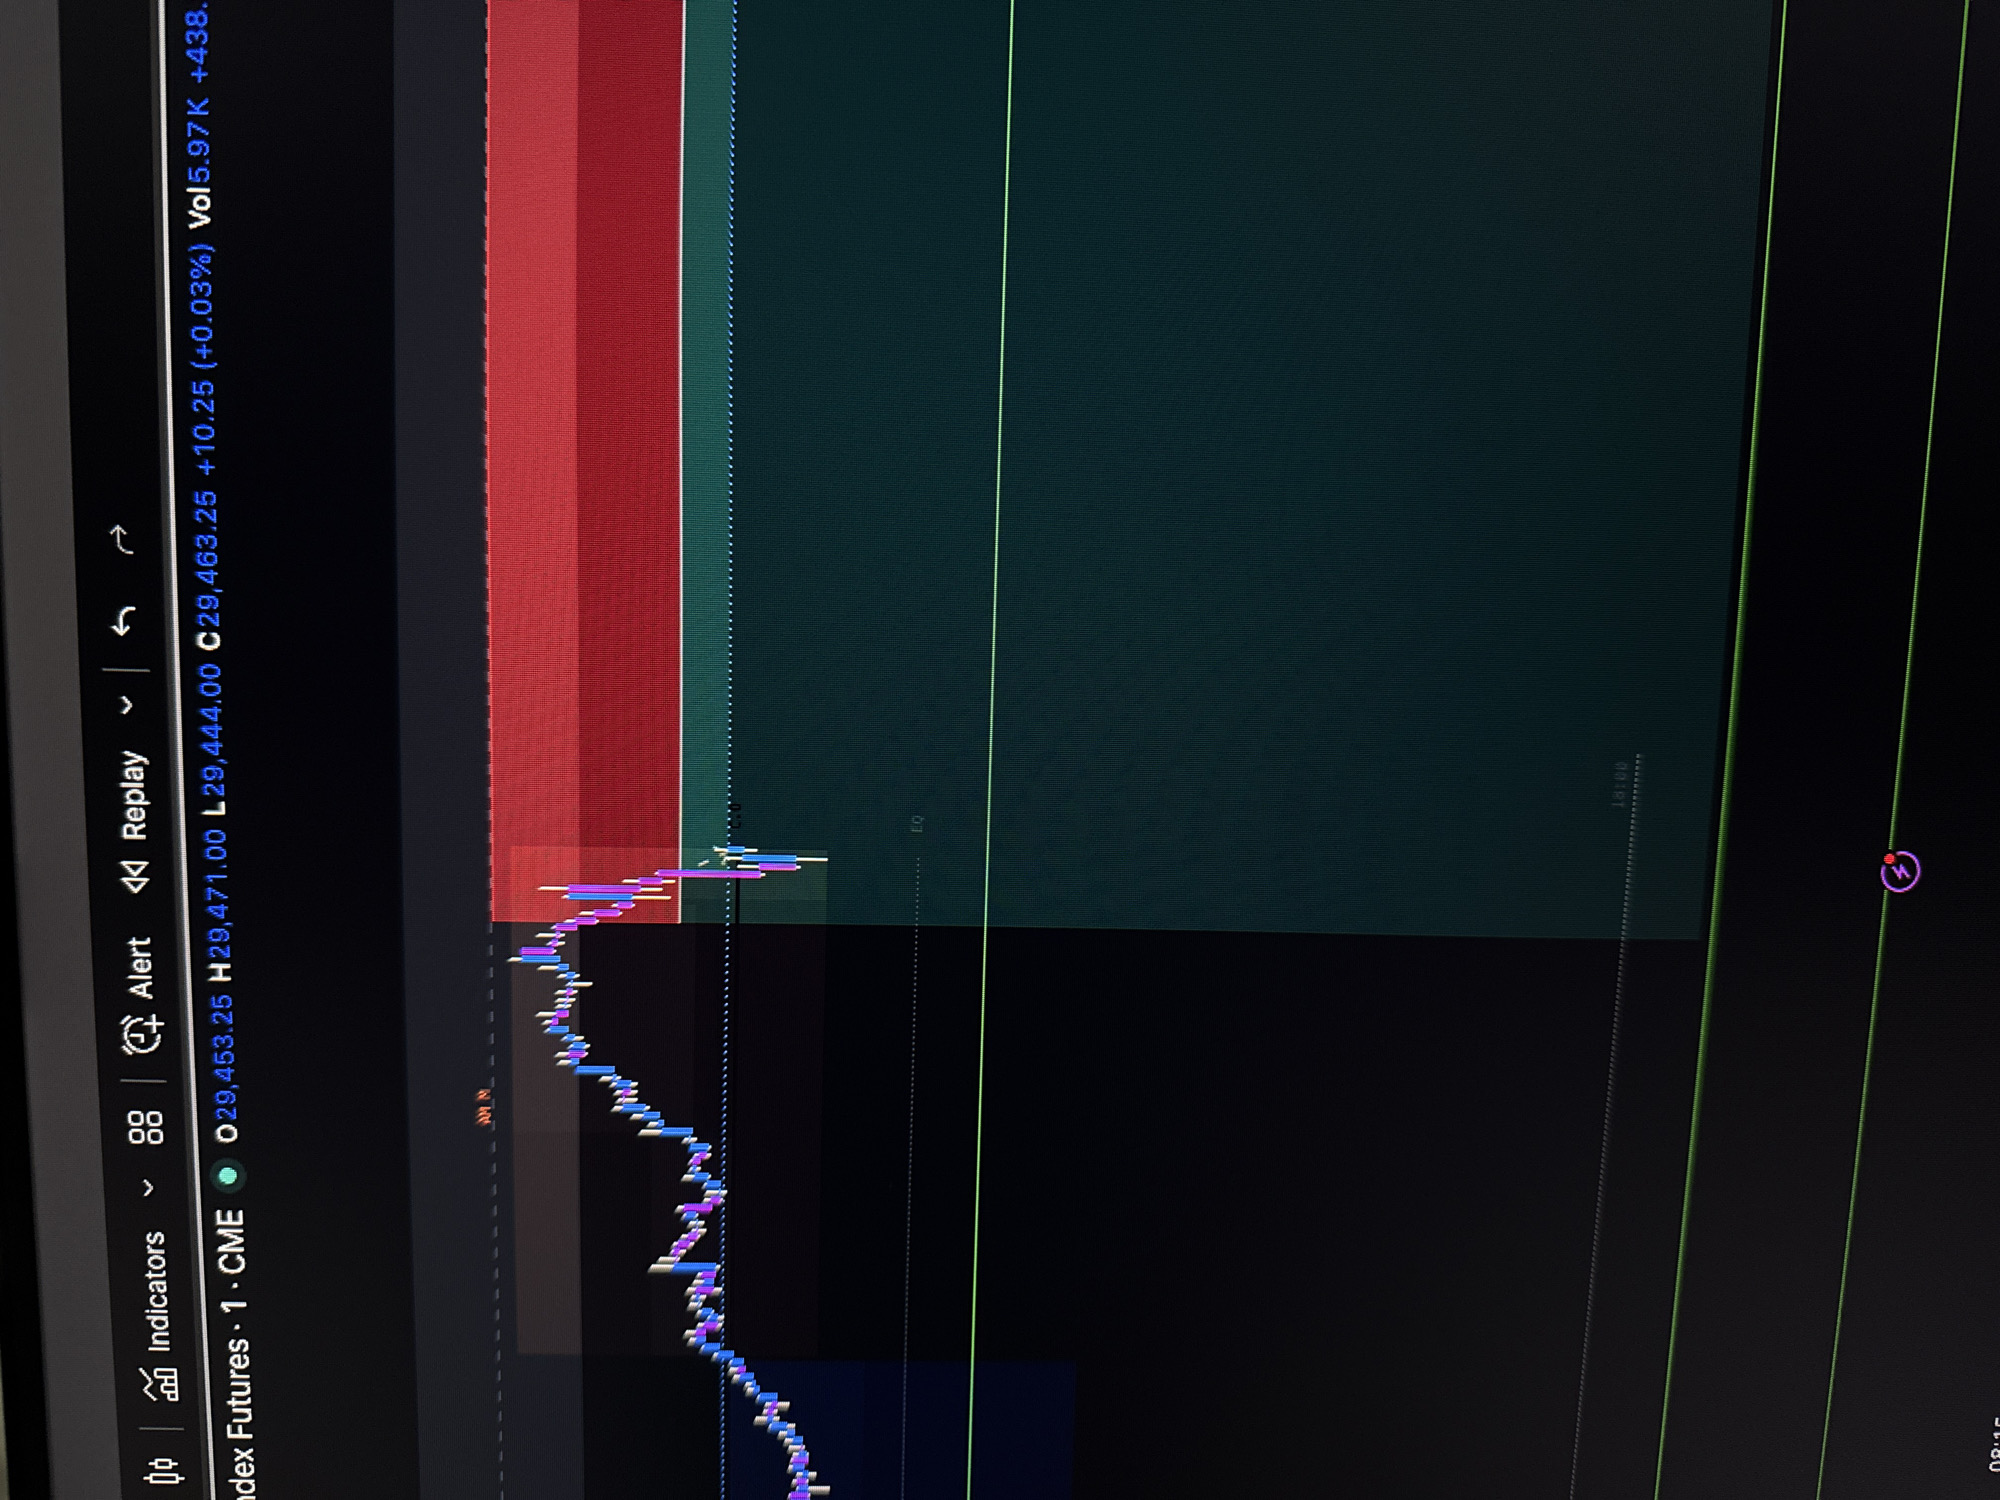
The image shows a close-up of a computer screen displaying a financial trading chart. The chart features candlestick patterns in blue, purple, and red, indicating price movements. There are also horizontal lines and shaded areas, likely representing support and resistance levels or trading zones. At the top of the screen, a toolbar shows icons for "Indicators," "Alert," and "Replay." Text overlays provide trading data such as "O 29,453.25," "H 29,471.00," "L 29,444.00," and "C 29,463.25." The background is dark, suggesting the screen is in a dimly lit environment. There is no information in the image that can be used to determine the location within the city of Delmenhorst, Germany.
Symbol
2AD37
Volume
3,957
Creator
+$0.04
Revenue
+$0.04
TVL
$3.13
2
Rev Bot 🤖💰
Injected revenue 13d ago
“Revenue bonus for the last stake.”
+$0.05 USD