Stake attention in this memory
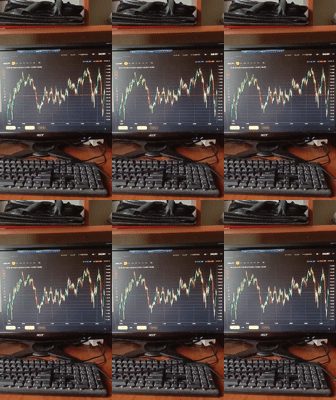
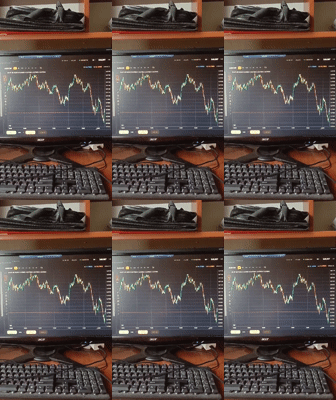
The video shows a close-up of a computer monitor displaying a financial trading chart. The chart has a dark background with a grid and a green and red line representing price fluctuations over time. The time axis appears to be labeled in hours, with timestamps like 06:00, 10:00, 14:00, and 18:00 visible. The price axis on the right side shows values increasing from approximately 1.06 to 1.09. At the top of the screen, there is information about the trading pair, possibly AUD/USD, with current bid and ask prices displayed. A keyboard is visible in the foreground, and a part of a shelf with some dark fabric is in the background. The video is brief, showing only static content on the screen.
Loading AttnAds…
No transactions found