Stake attention in this memory
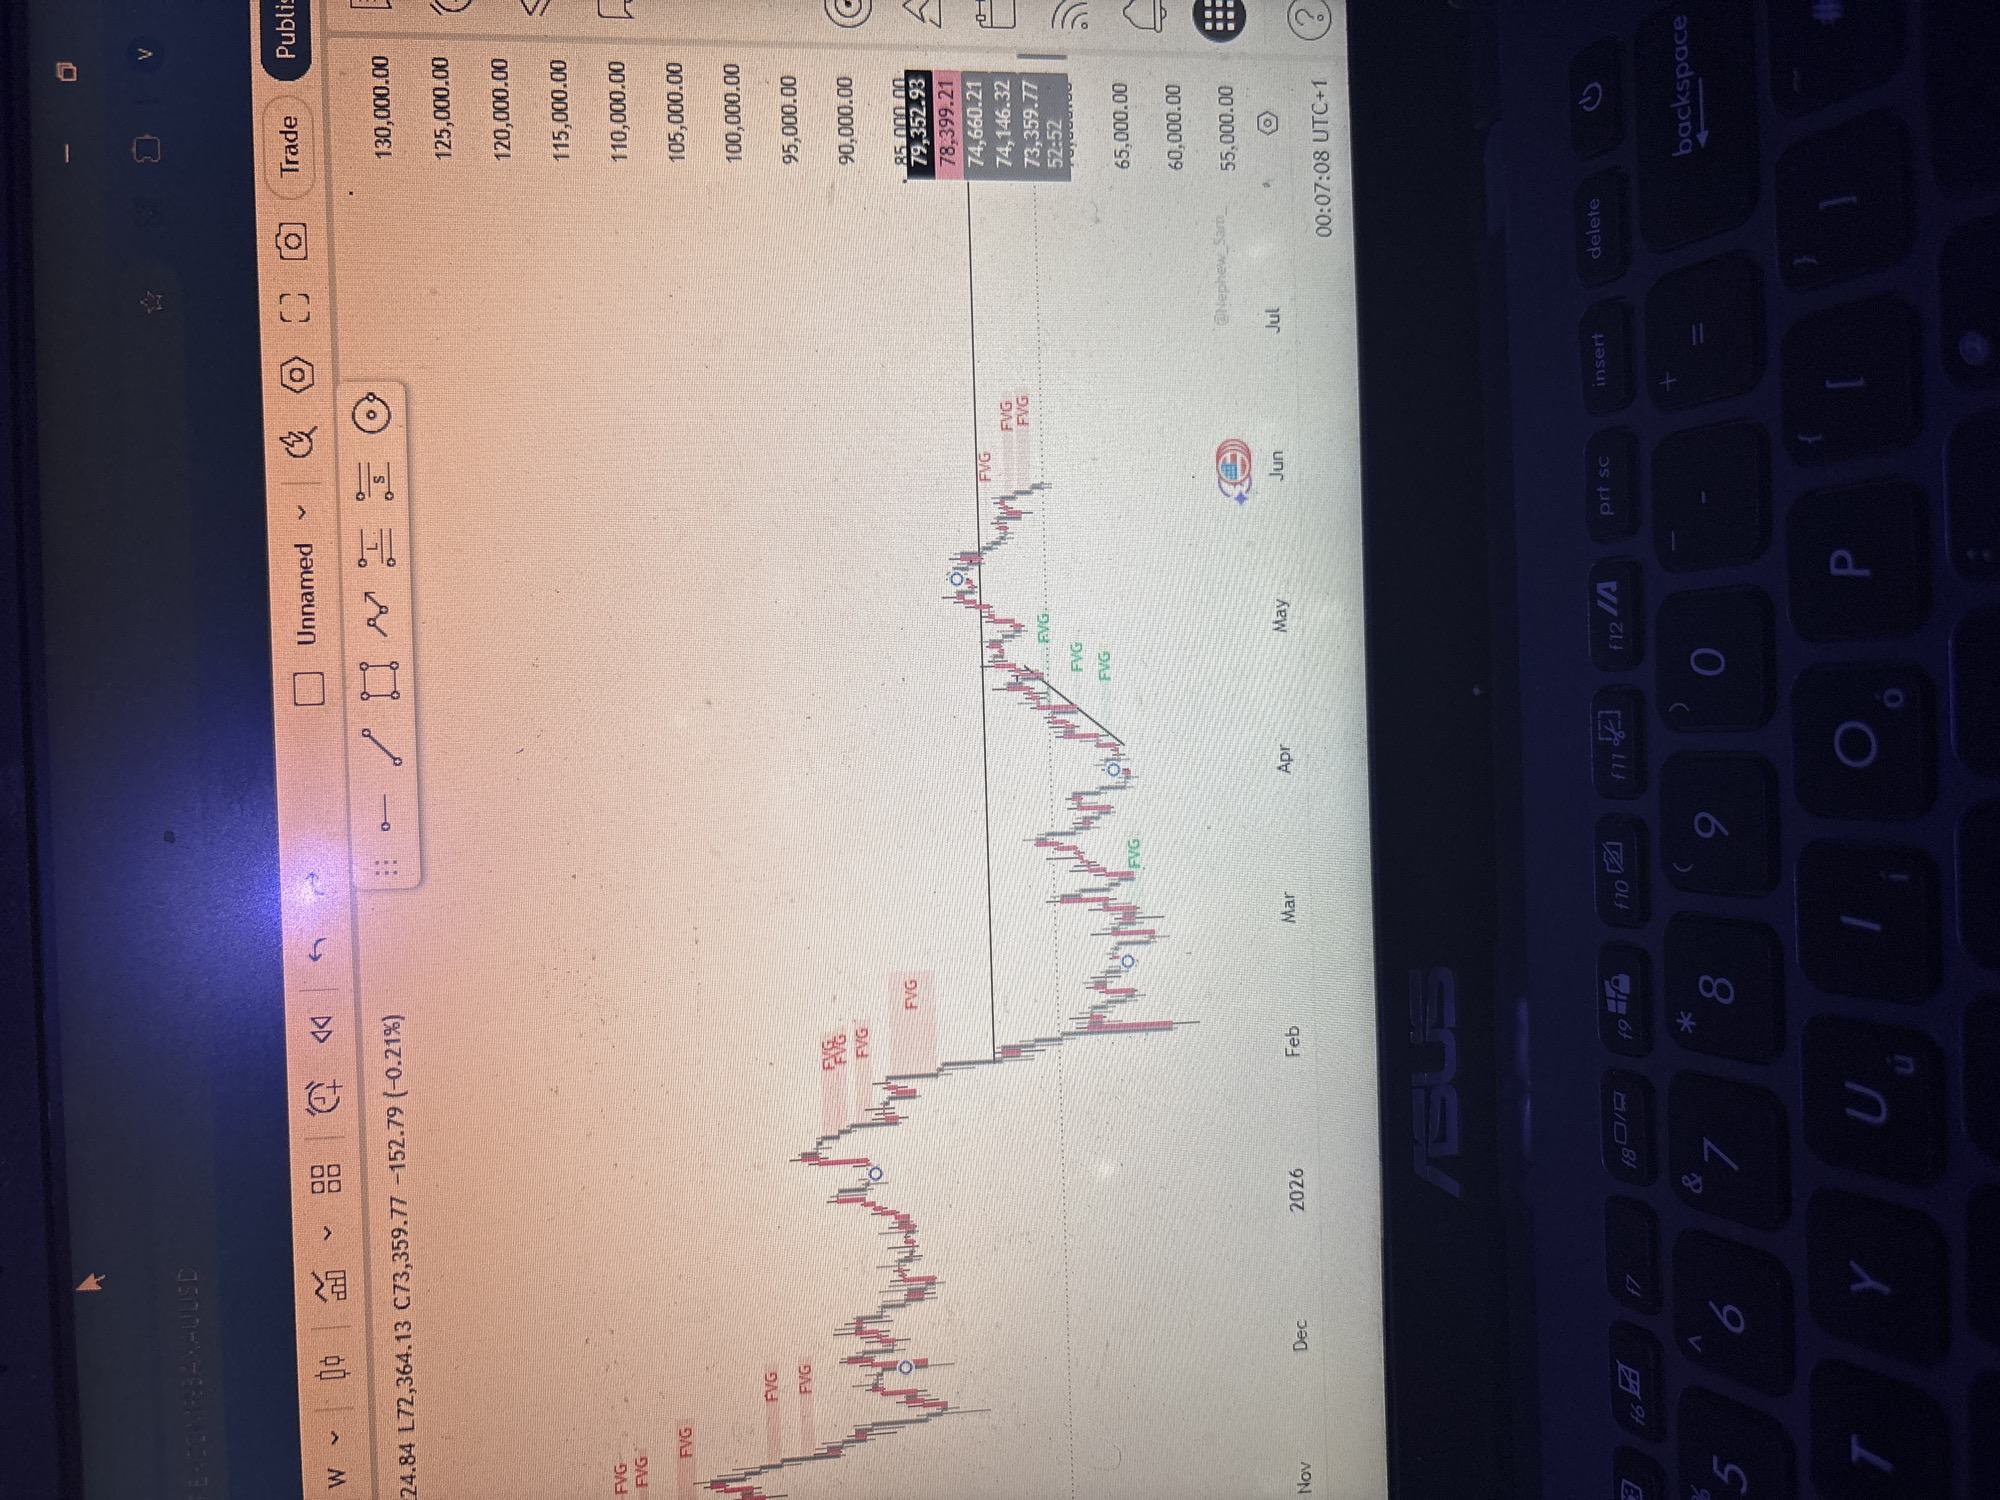
The image shows a computer screen displaying a financial chart. The chart is a candlestick chart, with red and green candles indicating price movements over time. The x-axis represents time, labeled with months from November 2025 to July 2026. The y-axis represents price, ranging from 55,000.00 to 130,000.00. The chart also includes labeled areas of Fair Value Gaps. The screen is part of a laptop, with the ASUS logo visible. The keyboard is also visible, with some keys partially obscured. The image also includes elements from the software used for creating the chart such as the chart title. The location in the city of Suleja, Nigeria is not evident in the image.
Symbol
2C58A
Volume
2,027
Creator
+$0.01
Revenue
+$0.00
TVL
$1.10