Stake attention in this memory
stock chart
laptop
trading view
financial data
candle chart
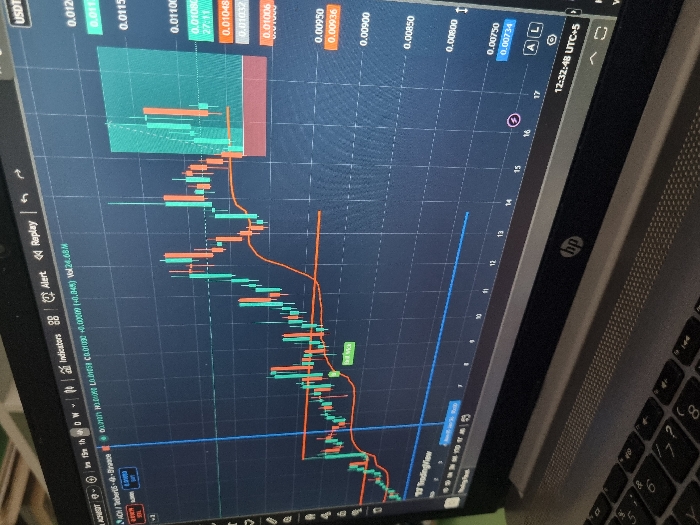
A laptop screen displays a cryptocurrency chart, identified as "ADX/USDT" on the Binance exchange. The chart shows candlestick patterns, representing price fluctuations over time, overlaid with a moving average line in orange. The current time is 12:32:48 UTC+5. Price values on the Y-axis range from 0.00734 to 0.012 USDT. Indicators, alerts, and replay buttons are visible on the left side. The computer keyboard is partially visible on the right.
Symbol
2CC18
Volume
168
Creator
+$0.00
Revenue
+$0.00
TVL
$0.03
1D
1W
1M
All
transactions
revenues
stakers