
Stake attention in this memory
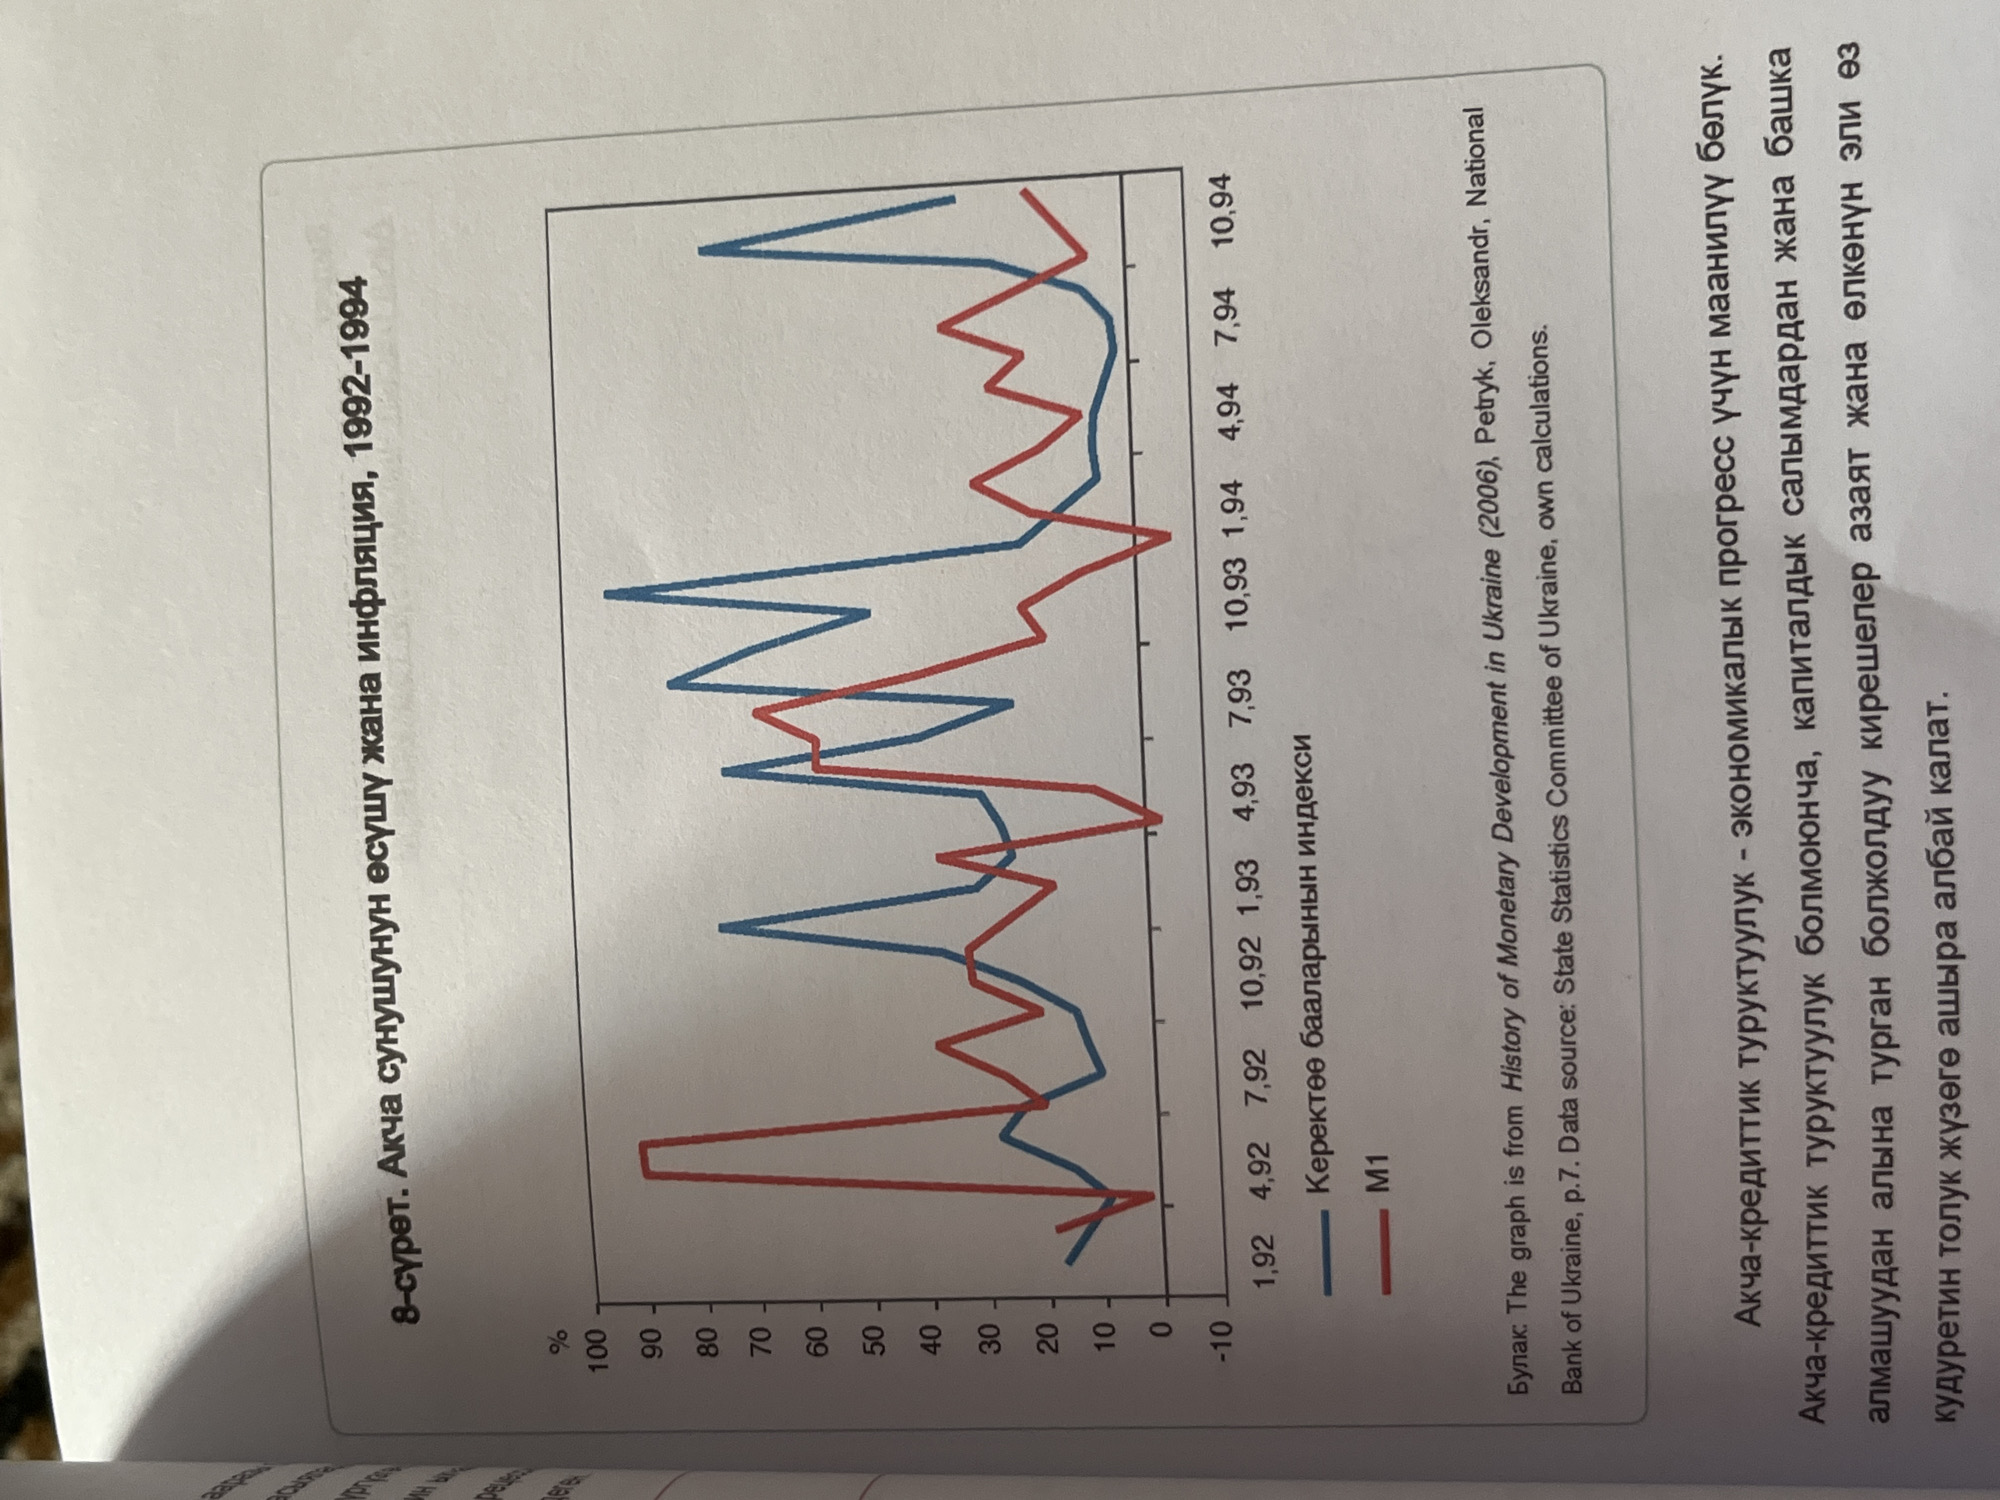
The image is a photograph of a page from a book or document, featuring a line graph and accompanying text. The graph plots two lines, one blue and one red, against a percentage scale on the y-axis and a time scale (years and months) on the x-axis. The title of the graph is in Russian and appears to be "8-suriet. Akcha sunushunyn eçushy jana inflaıtsııa, 1992-1994", which translates to "Figure 8. Money supply and inflation, 1992-1994". A legend below the graph indicates that the blue line represents "Kerektǝǝ baalarynyн indeкsі" (Consumer price index) and the red line represents "M1" (a measure of money supply). Below the graph, there is text in English stating that the graph is from "History of Monetary Development in Ukraine (2006), Petryk, Oleksandr, National Bank of Ukraine, p.7. Data source: State Statistics Committee of Ukraine, own calculations." Further text below this is in Cyrillic script. The lighting suggests the photograph was taken with ambient light.
Loading AttnAds…
No transactions found