Stake attention in this memory
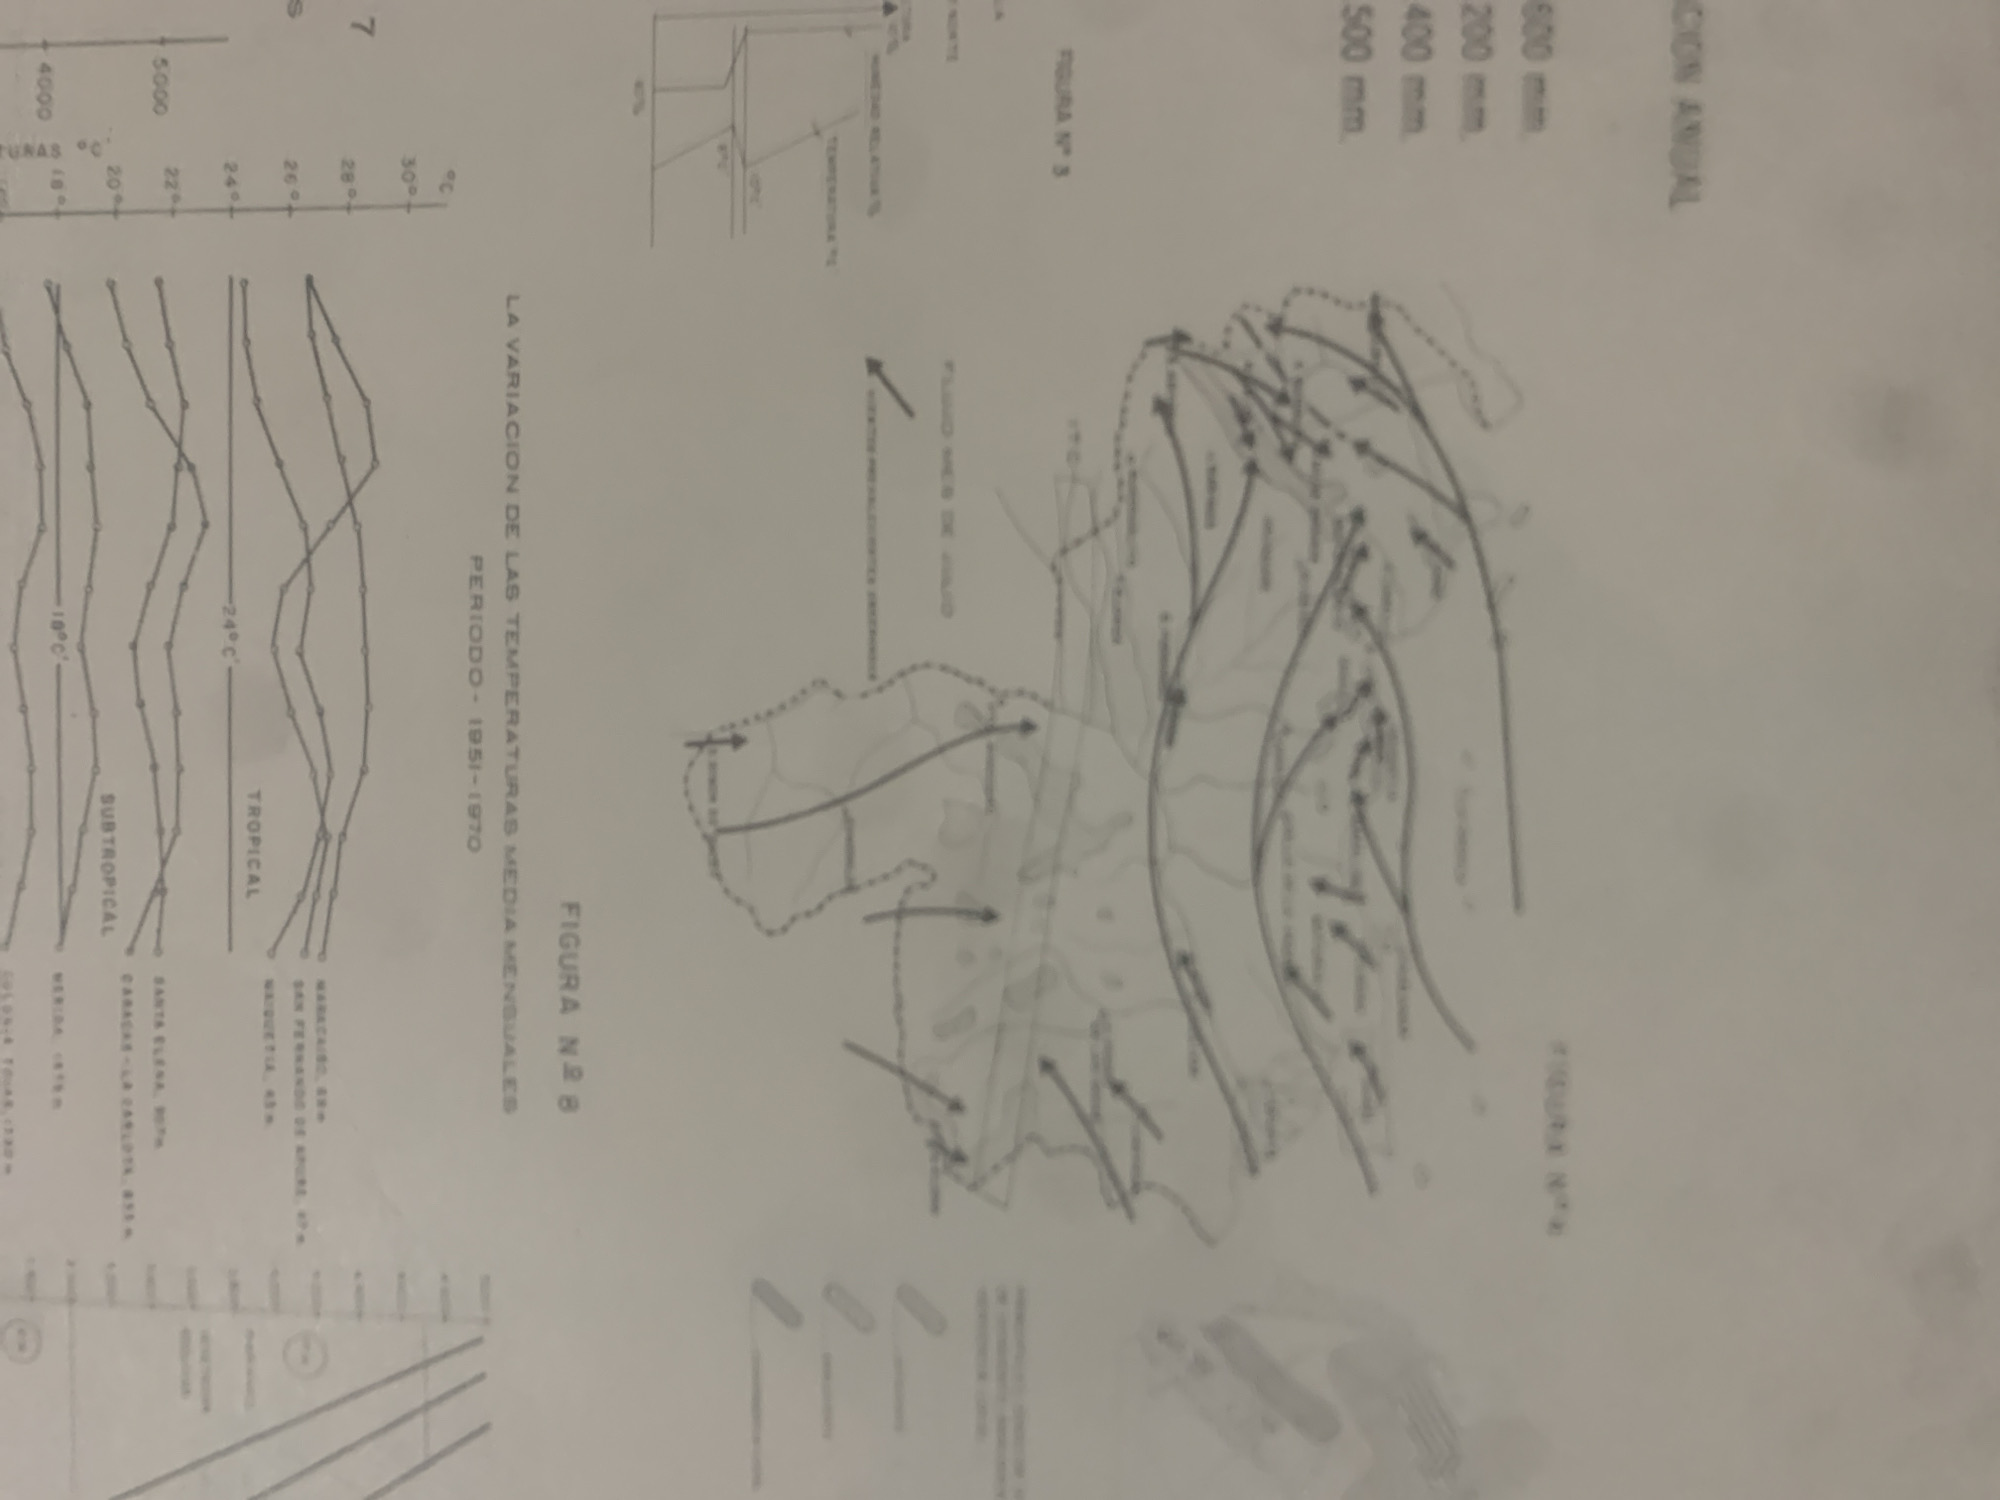
The image contains several graphs and a map. One graph shows temperature variations for "SUBTROPICAL" and "TROPICAL" climates. Another graph has labels for elevation (e.g., 4000, 5000) and temperature (e.g., 18°C, 20°C, 22°C, 24°C, 26°C, 28°C, 30°C). Text on the image includes "LA VARIACION DE LAS TEMPERATURAS MEDIA MENSUALES PERIODO - 1951-1970" and "FIGURA N° 8". To the right of these graphs, there is a diagram with labels like "TEMPERATURA" and some numerical values. The lower portion of the image features a map with various lines, arrows, and place names. Some of the visible text on this map includes "FLUIDO MES DE JULIO", "PROYECCION ELIPTICA", "TEMPERATURA", and "FIGURA N° 3". There are also labels for precipitation amounts in millimeters (mm) such as "500 mm", "400 mm", "200 mm", and "600 mm", along with the text "CION ANUAL". The image does not contain any specific details about the city of La Tagua, Venezuela, nor does it depict any people, subjects, objects, actions, or interactions in a way that would be considered forensic. It is primarily a collection of scientific or analytical diagrams and a map.
Symbol
30E2C
Volume
11,550
Creator
+$0.11
Revenue
+$0.21
TVL
$8.43
2
Rev Bot 🤖💰
Injected revenue 6d ago
“Revenue bonus for the last stake.”
+$0.23 USD