
Sign in
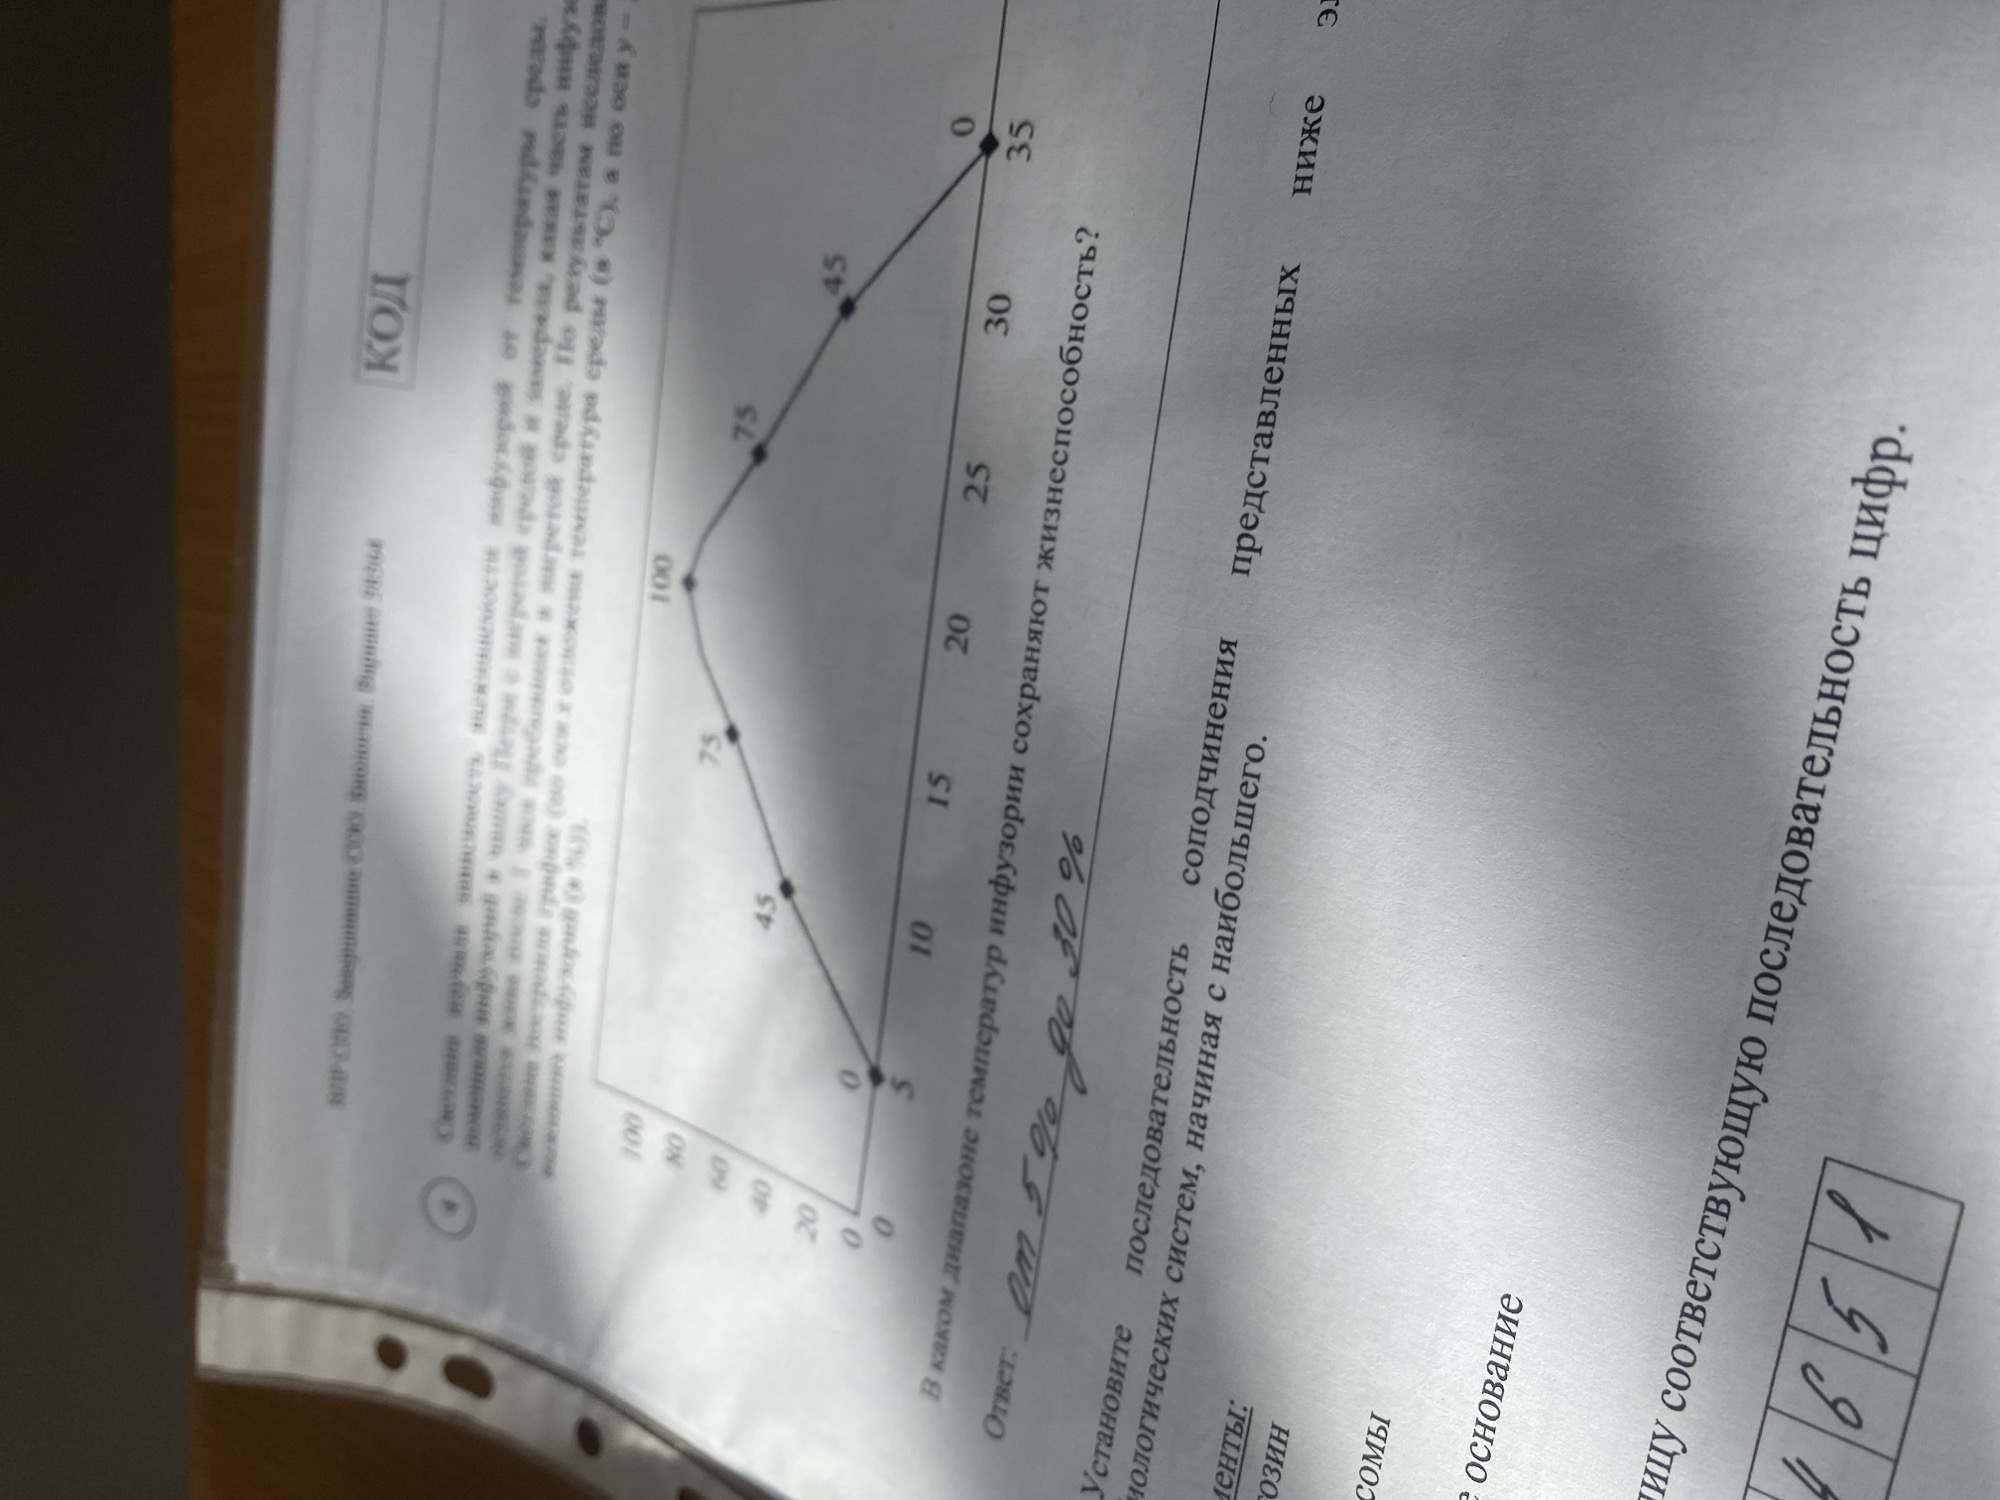
The image displays a slightly blurry, angled photograph of a printed document, likely an educational assignment or test, in an indoor setting on a wooden surface. The document, written in Russian, features a prominent line graph and two associated questions.

The graph illustrates the "vitality" or "viability" of infusoria (microorganisms) as a function of temperature. The x-axis represents temperature in degrees Celsius (°C), ranging from 0 to 35, while the y-axis, implicitly, shows viability in percentage, from 0 to 100. The curve shows 100% viability at 0°C and 5°C, then a decline, reaching 45% viability at 15°C, and dropping to 0% viability at 30°C.

The first question, circled with a "4", asks: "In what temperature range do infusoria maintain viability?" Below this question, a handwritten answer in blue ink reads: "Ответ: от 5% до 30%". Although the answer includes a percentage sign, it likely refers to a temperature range from 5°C to 30°C, interpreted from the graph where viability starts to decrease after 5°C and reaches zero at 30°C.

The second question, at the bottom left, asks to "Establish the sequence of biological systems, starting from the largest." Partial options are visible, including "Гозин" (unclear term), "сомы" (somas/bodies), and "е основание" (its base/foundation). Below this question, a handwritten answer in numbered boxes shows "4651".

The top right corner of the document includes a "КОД" (CODE) box. The document is partially held within a clear plastic folder or binder on the bottom left. The context for this document is Chaikovsky, Russia.
FM-gnNog2

Apr 28, 2026, 4:17 AM

Chaikovsky, Russia

Moment

Stake attention in this memory

academic
educational
study
analysis
data

The image displays a slightly blurry, angled photograph of a printed document, likely an educational assignment or test, in an indoor setting on a wooden surface. The document, written in Russian, features a prominent line graph and two associated questions. The graph illustrates the "vitality" or "viability" of infusoria (microorganisms) as a function of temperature. The x-axis represents temperature in degrees Celsius (°C), ranging from 0 to 35, while the y-axis, implicitly, shows viability in percentage, from 0 to 100. The curve shows 100% viability at 0°C and 5°C, then a decline, reaching 45% viability at 15°C, and dropping to 0% viability at 30°C. The first question, circled with a "4", asks: "In what temperature range do infusoria maintain viability?" Below this question, a handwritten answer in blue ink reads: "Ответ: от 5% до 30%". Although the answer includes a percentage sign, it likely refers to a temperature range from 5°C to 30°C, interpreted from the graph where viability starts to decrease after 5°C and reaches zero at 30°C. The second question, at the bottom left, asks to "Establish the sequence of biological systems, starting from the largest." Partial options are visible, including "Гозин" (unclear term), "сомы" (somas/bodies), and "е основание" (its base/foundation). Below this question, a handwritten answer in numbered boxes shows "4651". The top right corner of the document includes a "КОД" (CODE) box. The document is partially held within a clear plastic folder or binder on the bottom left. The context for this document is Chaikovsky, Russia.

transactions
revenues
stakers
Earliest
Latest
Highest stake

No transactions found

More from this user

More from Chaikovsky

FM-gnNog2

Apr 28, 2026, 4:17 AM

Chaikovsky, Russia

Licensed under Creative Commons Attribution 4.0 International License. You are free to share and adapt this content with proper attribution.