Stake attention in this memory
Focused
Intense
Strategic
Hopeful
Determined
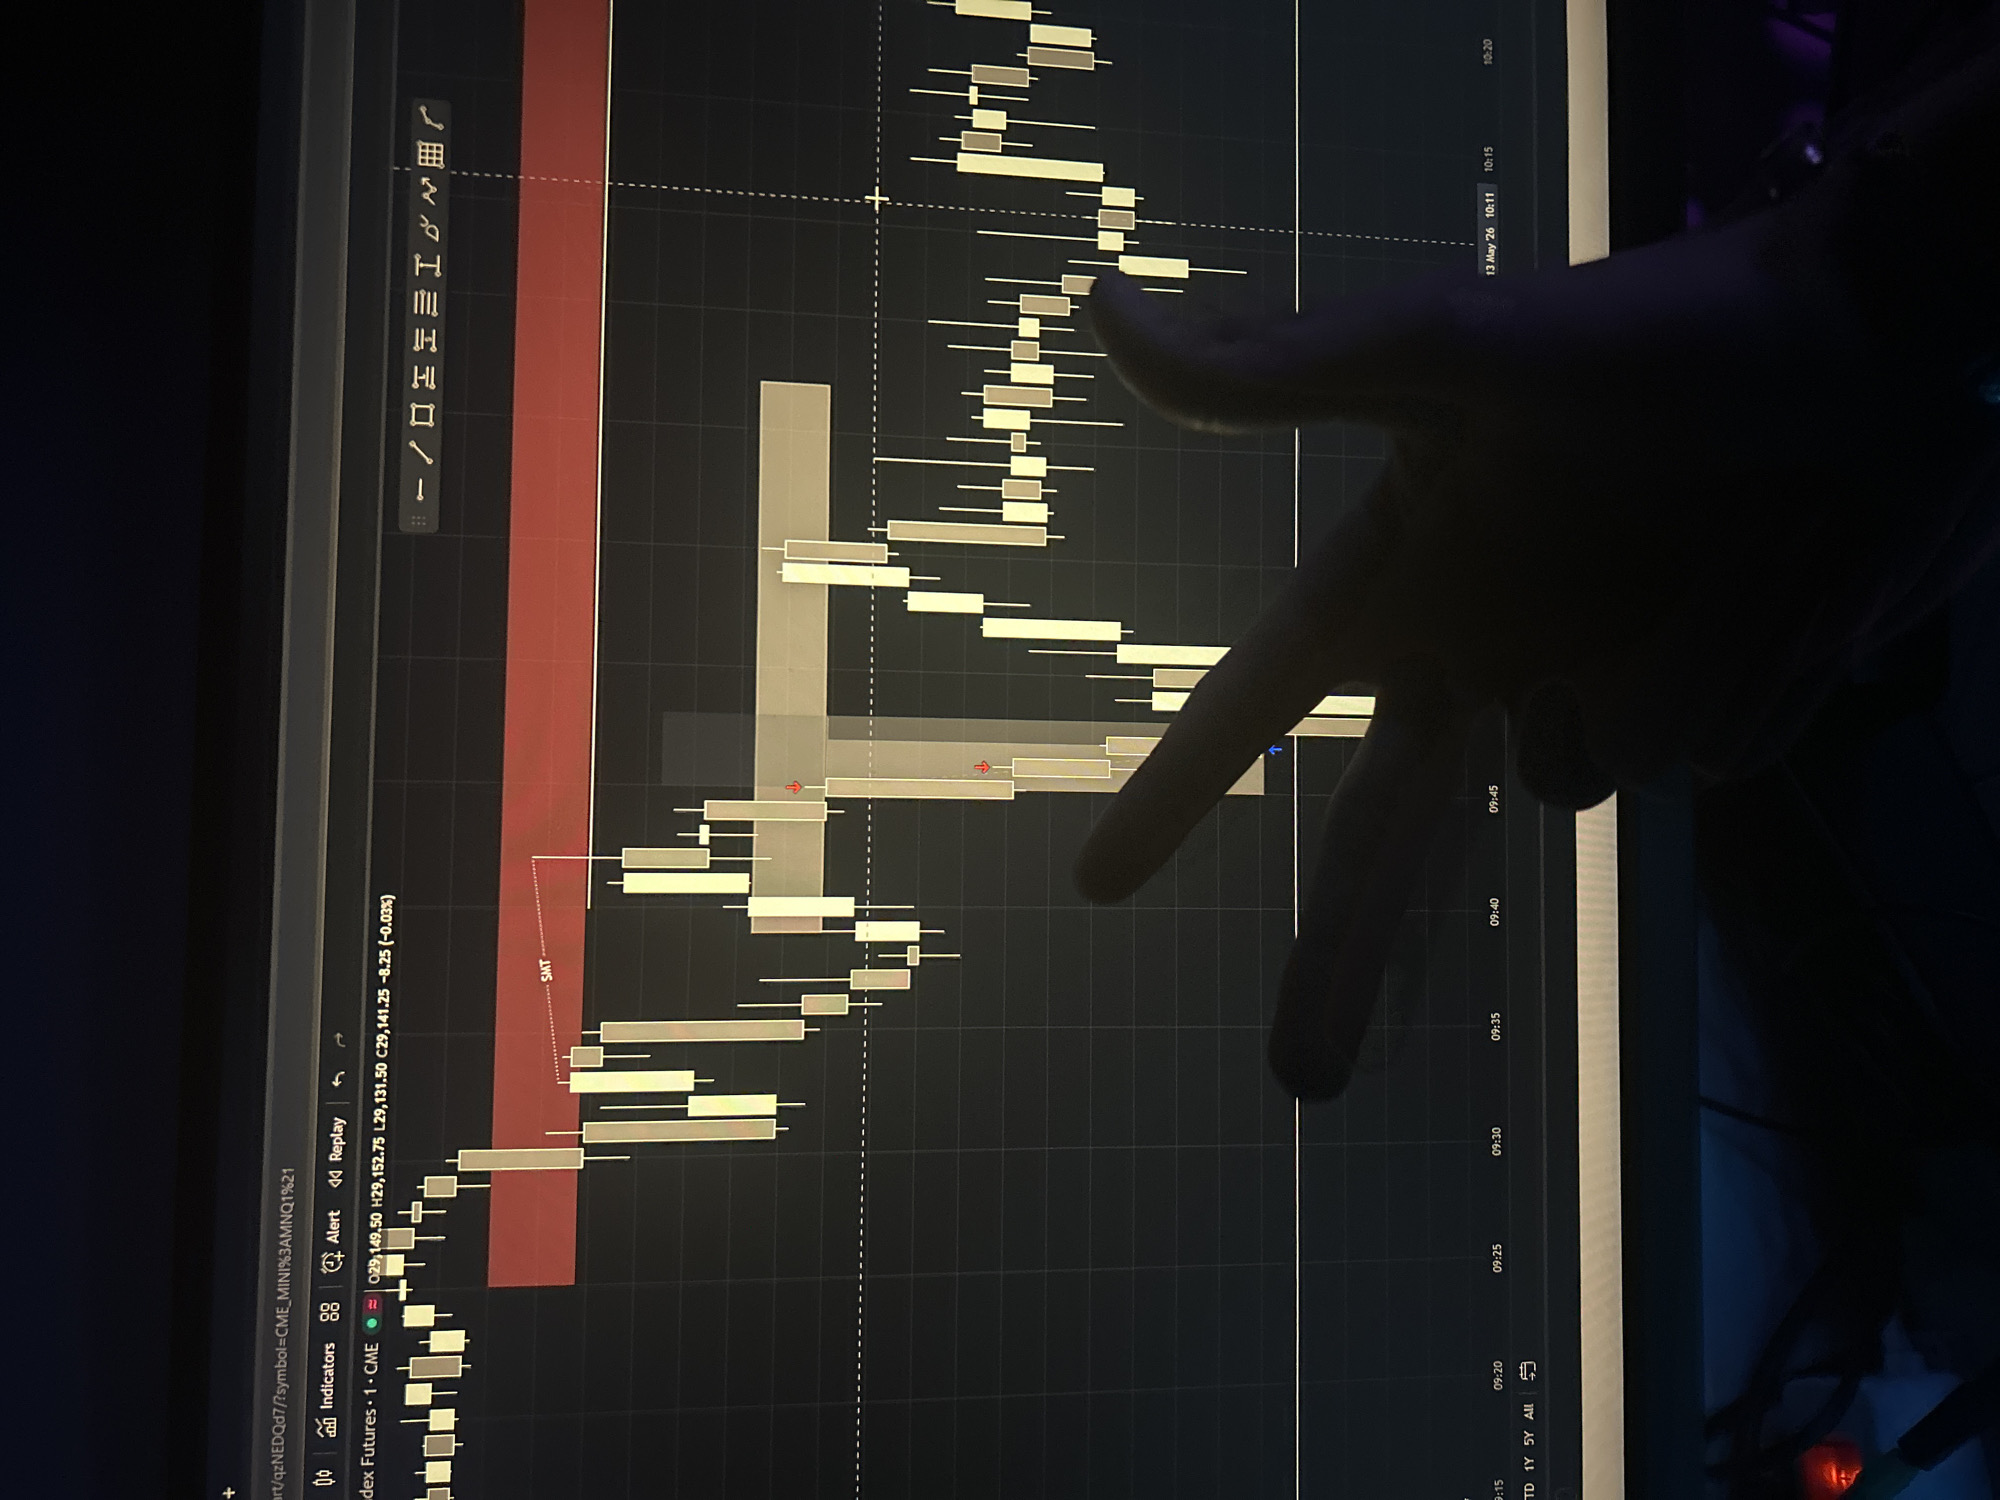
The image shows a computer screen displaying a candlestick chart, likely for financial trading, with a hand partially obscuring the view. The chart features red and tan candlesticks, indicating price movements over time. The X-axis shows time intervals, ranging from 09:15 to 10:20, and including the date of 13 May 26 at 10:11. The left side of the screen has icons for drawing tools and options for indicators, alerts, and replay. Text at the bottom identifies the chart as "Index Futures. 1. CME" with associated price data. The setting and action appear to be related to stock market trading. There is no indication of Varna, Bulgaria.
Symbol
43CA2
Volume
316
Creator
+$0.00
Revenue
+$0.00
TVL
$0.01
1D
1W
1M
All
Loading AttnAds…
transactions
revenues
stakers
Earliest
Latest
Highest stake