
Stake attention in this memory
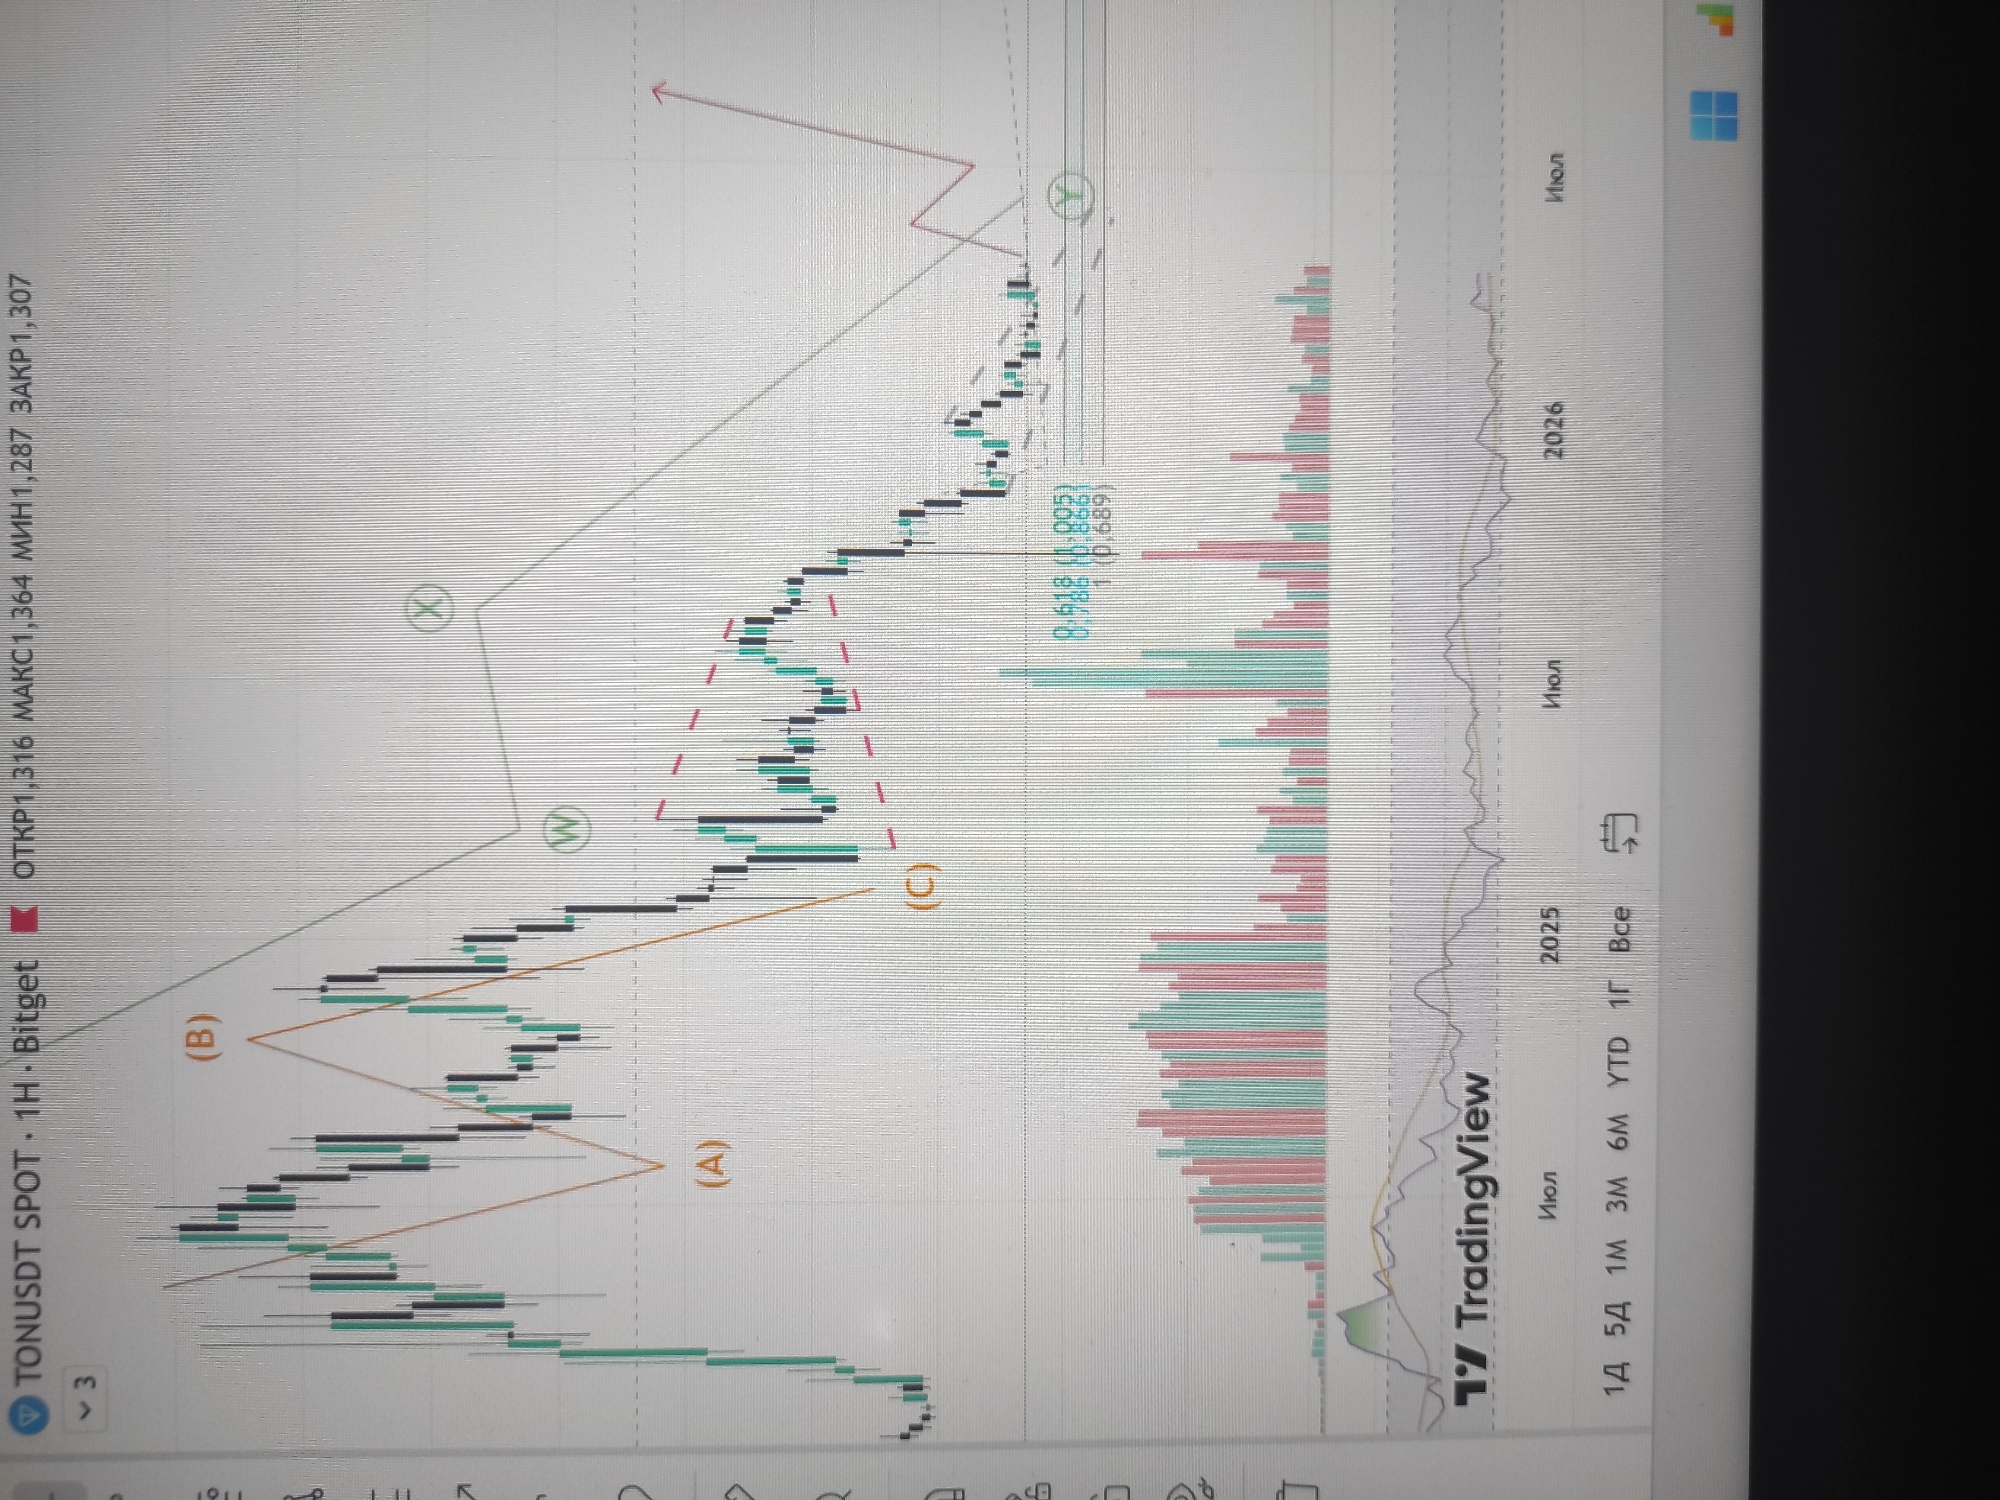
The image displays a digital screen, likely a computer monitor or tablet, showing a cryptocurrency trading chart from the TradingView platform. The chart is for the TONUSDT SPOT pair on the Bitget exchange, viewed at a 1-hour timeframe. Candlestick patterns illustrate price movements, overlaid with technical analysis lines and labels, including "A", "B", "C", "W", "X", and "Y", possibly indicating Elliott Wave patterns. Fibonacci retracement levels, specifically "0.618 (1.005)" and "0.5 (0.889)", are visible on the right side of the chart. Below the price chart, a volume histogram shows trading activity. The horizontal axis indicates dates, with "2025" and "2026" and "Июл" (July) visible. Various timeframe options like "1Д" (1D), "5Д" (5D), "1М" (1M), "3М" (3M), "6М" (6M), "YTD", "1Г" (1Y), and "Все" (All) are displayed at the bottom right. Text on the top left provides current price information in Russian: "ОТКР1,316" (Open 1.316), "МАКС1,364" (High 1.364), "МИН1,287" (Low 1.287), and "ЗАКР1,307" (Close 1.307). Windows OS icons are faintly visible in the top right corner of the screen. No people or specific outdoor location cues are visible, but the use of Cyrillic text is consistent with the given location context of Sevastopol, Ukraine.
Loading AttnAds…
No transactions found