Stake attention in this memory
anxiety
tension
uncertainty
frustration
hope
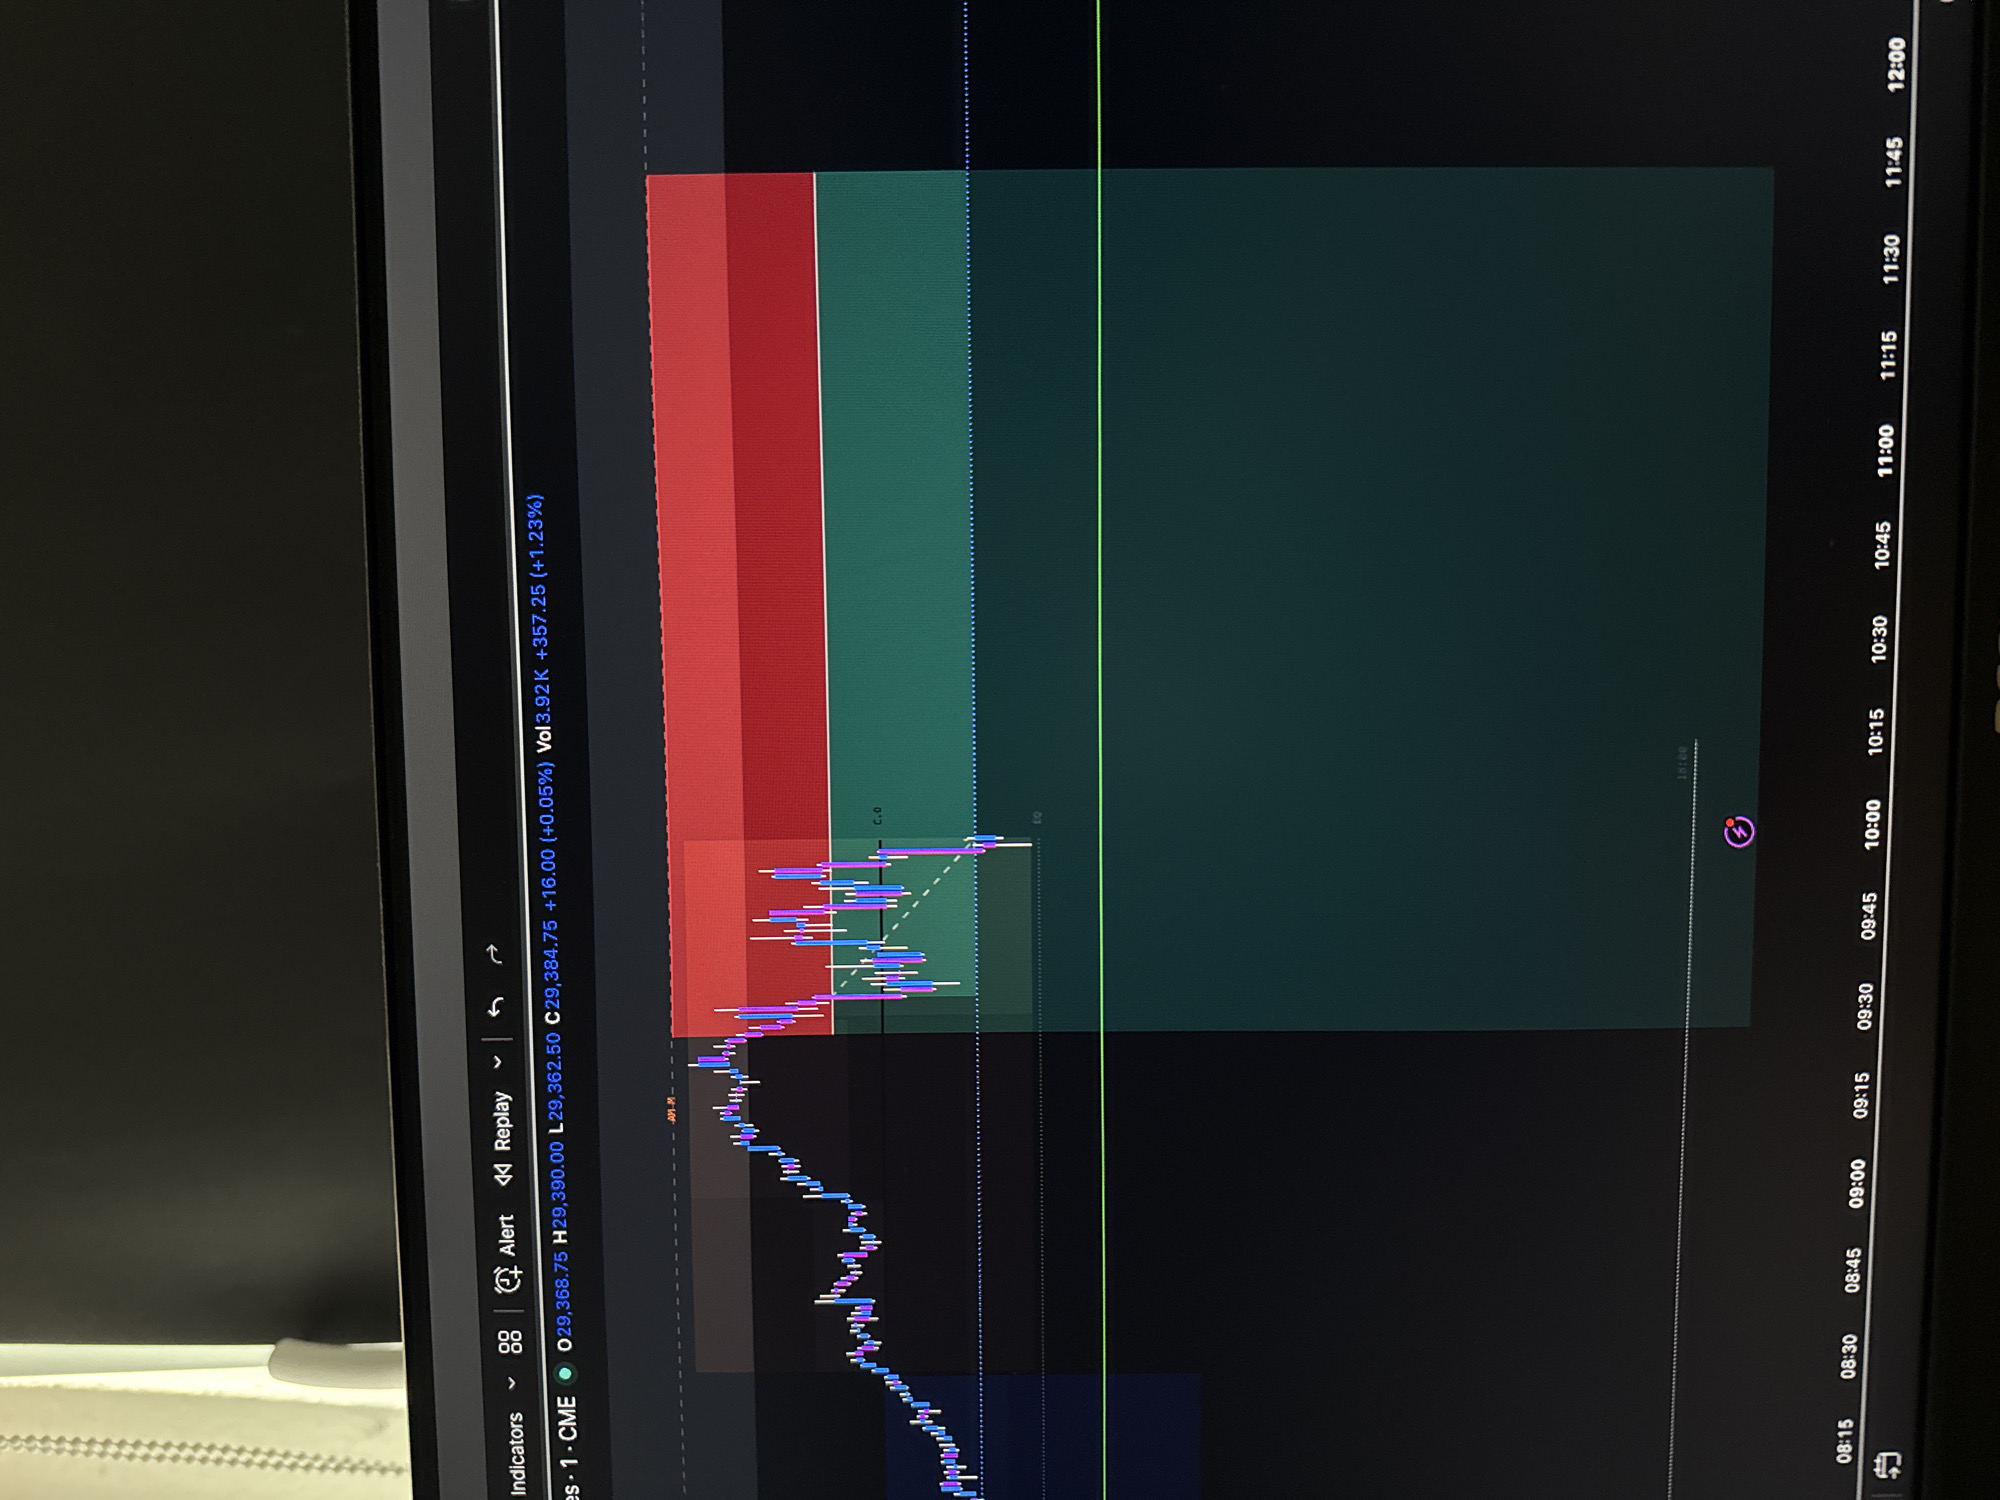
The image shows a computer screen displaying a financial trading chart. The chart features candlestick patterns in shades of blue, purple, and white, indicating price movements over time. There are also horizontal lines and shaded areas in red and green, likely representing support and resistance levels or trade zones. The bottom of the screen shows a time axis with labels ranging from 08:15 to 12:00. The scene appears to be an indoor setting, likely an office or home environment, with the computer monitor being the primary subject. There is no information within the image that relates to the city of Delmenhorst, Germany, or any specific location.
Symbol
4F4EF
Volume
0
Creator
+$0.08
Revenue
+$0.00
TVL
$0.00
1D
1W
1M
All
transactions
revenues
stakers
Earliest
Latest
Highest stake