Stake attention in this memory
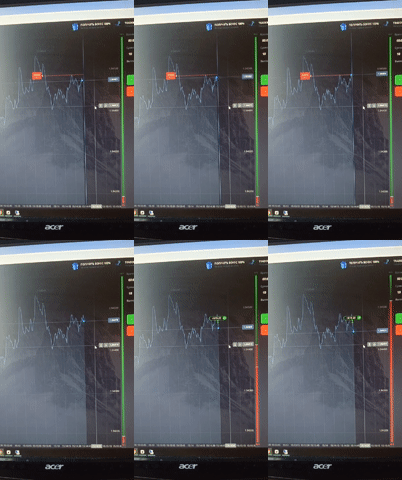
The image shows a close-up of a computer monitor displaying a financial trading chart. The chart depicts the price movement of AUDCHF, with time intervals marked on the x-axis (from 00 to 27, likely representing days) and price levels on the y-axis (ranging from 0.56700 to 0.57900). The trading graph shows a volatile trend, with an initial upward movement followed by a sharp decline and then a partial recovery. Key elements visible on the screen include: - A trading platform interface with various time frame options (1M, 5M, 15M, 1H, 4H, 1D, 1W). The 15M (15-minute) interval is currently selected. - Bid and Ask prices: BID 0.57830, ASK 0.57835. - Spread value: 1. - A timestamp: 15:56:08. - A connected status indicator. - Account balance: $48,196. - A detailed trade entry: 26-08-27 15:45 O 0.57842 H 0.57847 L 0.57822 C 0.57827. - Drawing tools icons on the left side of the chart. - Buy, Sell, and Close All buttons at the bottom of the chart. - The "acer" logo is visible on the monitor's bezel. The environment suggests an indoor setting, with a desk or surface visible below the monitor, partially illuminated by the screen's light. The background of the monitor is dark, suggesting it's within a room. There is no information in the image that would allow for the determination of the specific location within the city of Ухманы, Russia.
Loading AttnAds…
No transactions found