Sign in
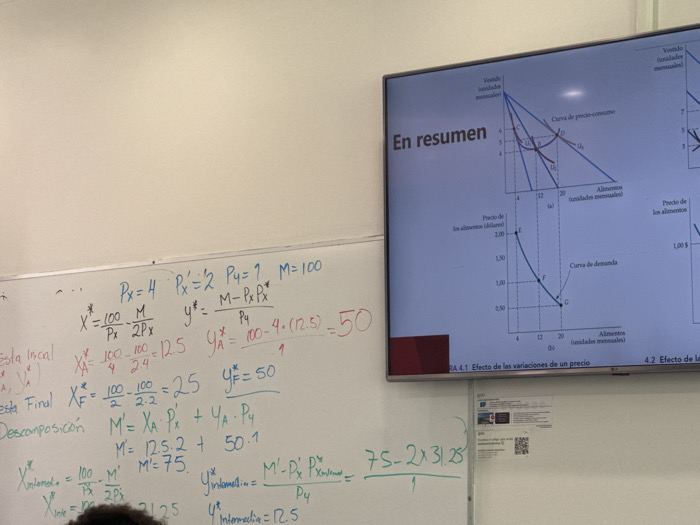
The image depicts an academic setting, likely a classroom or lecture hall, in Puebla City, Mexico. A white wall dominates the background. On the left side, a dry-erase board is filled with handwritten economic equations and calculations using blue and red markers, involving variables such as Px, Py, M, X*, and Y*, and Spanish terms like "Descomposición" and "Esta Incial." On the right, a large, dark-framed flat-screen monitor displays a presentation slide titled "En resumen" (In summary). This slide features two microeconomic graphs: graph (a) illustrates indifference curves (U0, U1), budget lines, and a price-consumption curve with axes labeled "Vestido (unidades mensuales)" (Clothing, monthly units) and "Alimentos (unidades mensuales)" (Food, monthly units); graph (b) presents a demand curve with "Precio de los alimentos (dólares)" (Price of food, dollars) and "Alimentos (unidades mensuales)" axes. The caption below the graphs reads "RA 4.1 Efecto de las variaciones de un precio" (RA 4.1 Effect of price variations). A small portion of a dark-haired head is visible at the bottom center of the frame, suggesting an individual observing the content.
Leo_Orozco15

Oct 6, 2025, 7:35 PM

Puebla City, Mexico

Stake attention in this memory

Concentration
Academic
Frustration
Confusion
Learning

The image depicts an academic setting, likely a classroom or lecture hall, in Puebla City, Mexico. A white wall dominates the background. On the left side, a dry-erase board is filled with handwritten economic equations and calculations using blue and red markers, involving variables such as Px, Py, M, X*, and Y*, and Spanish terms like "Descomposición" and "Esta Incial." On the right, a large, dark-framed flat-screen monitor displays a presentation slide titled "En resumen" (In summary). This slide features two microeconomic graphs: graph (a) illustrates indifference curves (U0, U1), budget lines, and a price-consumption curve with axes labeled "Vestido (unidades mensuales)" (Clothing, monthly units) and "Alimentos (unidades mensuales)" (Food, monthly units); graph (b) presents a demand curve with "Precio de los alimentos (dólares)" (Price of food, dollars) and "Alimentos (unidades mensuales)" axes. The caption below the graphs reads "RA 4.1 Efecto de las variaciones de un precio" (RA 4.1 Effect of price variations). A small portion of a dark-haired head is visible at the bottom center of the frame, suggesting an individual observing the content.

Loading AttnAds…

transactions
revenues
stakers
Earliest
Latest
Highest stake

No transactions found

More from this user

More from Puebla City

Leo_Orozco15

Oct 6, 2025, 7:35 PM

Puebla City, Mexico

Licensed under Creative Commons Attribution 4.0 International License. You are free to share and adapt this content with proper attribution.