
Sign in
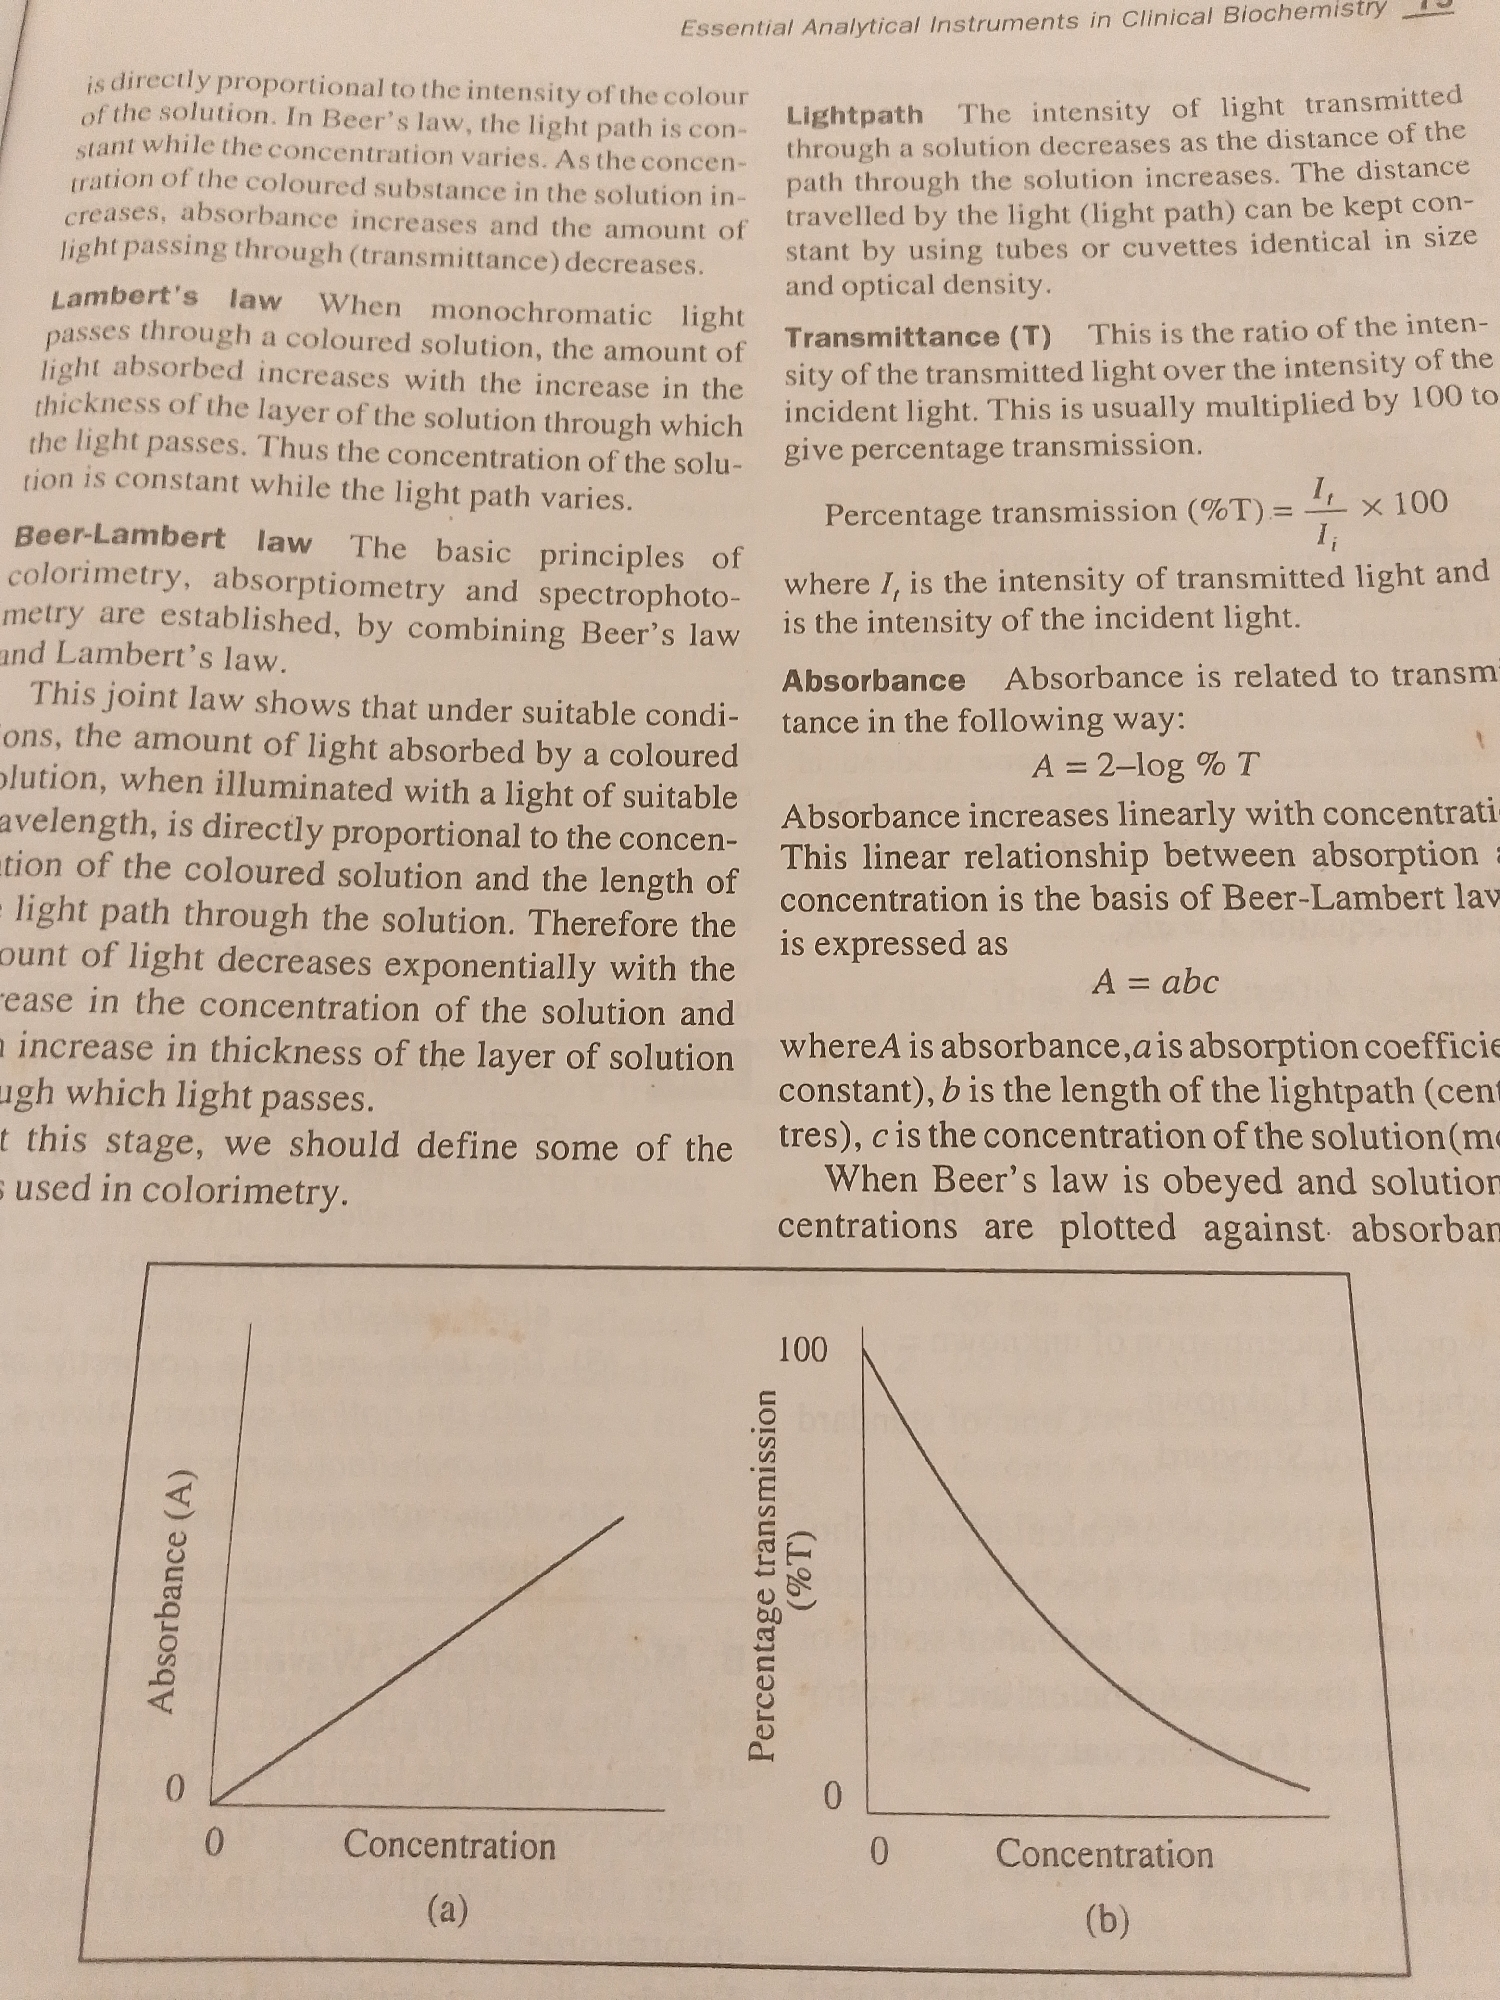
This media file is a page from a textbook, likely related to analytical chemistry or biochemistry, as indicated by the title "Essential Analytical Instruments in Clinical Biochemistry". The page contains text and two graphs illustrating scientific principles.

The text discusses Beer's law, Lambert's law, and the Beer-Lambert law, which relate the absorption of light by a solution to its concentration and the path length of the light through the solution. It also defines concepts like lightpath, transmittance, and absorbance. The text includes mathematical formulas for percentage transmission and absorbance.

The two graphs, labeled (a) and (b), depict graphical representations of these laws. Graph (a) shows a linear relationship between "Absorbance (A)" on the y-axis and "Concentration" on the x-axis, starting from the origin. Graph (b) shows a curve where "Percentage transmission (%T)" on the y-axis decreases as "Concentration" on the x-axis increases, with the curve starting at 100% transmission at zero concentration and approaching zero transmission at higher concentrations.

There are no people or specific objects beyond the textbook itself. The scene is a plain page with printed text and graphs. No time of day, weather, or location cues are visible, other than what can be inferred from the book's title. The overall tone is informative and scientific.
FM-qTLKq1

Jun 29, 2026, 2:02 PM

Jalingo, Nigeria

Stake attention in this memory

Informative
Scientific
Educational
Analytical
Technical

This media file is a page from a textbook, likely related to analytical chemistry or biochemistry, as indicated by the title "Essential Analytical Instruments in Clinical Biochemistry". The page contains text and two graphs illustrating scientific principles. The text discusses Beer's law, Lambert's law, and the Beer-Lambert law, which relate the absorption of light by a solution to its concentration and the path length of the light through the solution. It also defines concepts like lightpath, transmittance, and absorbance. The text includes mathematical formulas for percentage transmission and absorbance. The two graphs, labeled (a) and (b), depict graphical representations of these laws. Graph (a) shows a linear relationship between "Absorbance (A)" on the y-axis and "Concentration" on the x-axis, starting from the origin. Graph (b) shows a curve where "Percentage transmission (%T)" on the y-axis decreases as "Concentration" on the x-axis increases, with the curve starting at 100% transmission at zero concentration and approaching zero transmission at higher concentrations. There are no people or specific objects beyond the textbook itself. The scene is a plain page with printed text and graphs. No time of day, weather, or location cues are visible, other than what can be inferred from the book's title. The overall tone is informative and scientific.

Loading AttnAds…

transactions
revenues
stakers
Earliest
Latest
Highest stake

No transactions found

More from this user

More from Jalingo

FM-qTLKq1

Jun 29, 2026, 2:02 PM

Jalingo, Nigeria

Licensed under Creative Commons Attribution 4.0 International License. You are free to share and adapt this content with proper attribution.