
Sign in
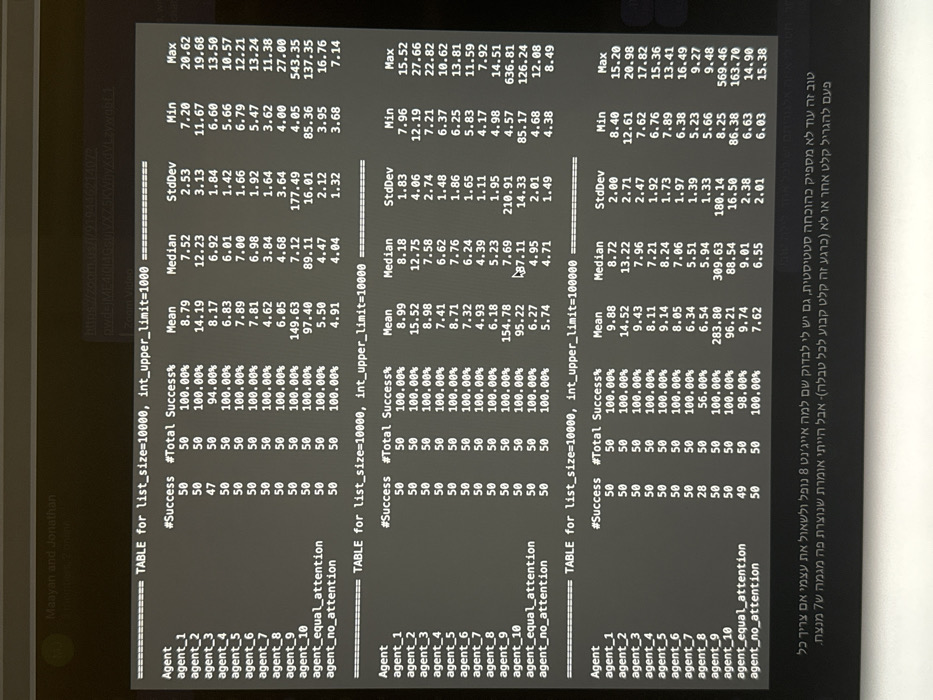
The image displays a computer screen showing three tables of data, likely output from a simulation or experiment. The subjects are statistical performance metrics for various "agents" (Agent_1 to Agent_10, agent_equal_attention, agent_no_attention) under different `int_upper_limit` conditions (1000, 10000, 100000), while `list_size` remains constant at 10000. Each table includes columns for `#Success`, `#Total`, `Success%`, `Mean`, `Median`, `StdDev`, `Min`, and `Max`.

The activity involves presenting and evaluating agent performance. For instance, in the first table (`int_upper_limit=1000`), Agent_3 has a 94.00% success rate (47 out of 50 trials), while all other agents achieve 100% success. In the third table (`int_upper_limit=100000`), Agent_8 shows a significantly lower success rate of 56.00% (28 out of 50 trials), and agent_equal_attention has 98.00% success (49 out of 50). Agents 9 and 10 consistently show much higher Mean and Max values compared to other agents across all tables.

Notable text includes "Maayan and Jonathan," possibly indicating the researchers. A Hebrew comment at the bottom reads, "Okay, this is not yet enough for statistical proof, I also need to check why Agent 8 fails there and ask myself if I need to generate different input every time or not (currently it's fixed input for each table) - but I would say a winning trend is being created here." This suggests an ongoing analysis and a critical look at the results, particularly Agent 8's performance. The Hebrew text provides a strong location cue to Israel.
Nypple

Feb 13, 2025, 4:57 PM

Tel Aviv-Yafo, Israel

Stake attention in this memory

The image displays a computer screen showing three tables of data, likely output from a simulation or experiment. The subjects are statistical performance metrics for various "agents" (Agent_1 to Agent_10, agent_equal_attention, agent_no_attention) under different `int_upper_limit` conditions (1000, 10000, 100000), while `list_size` remains constant at 10000. Each table includes columns for `#Success`, `#Total`, `Success%`, `Mean`, `Median`, `StdDev`, `Min`, and `Max`. The activity involves presenting and evaluating agent performance. For instance, in the first table (`int_upper_limit=1000`), Agent_3 has a 94.00% success rate (47 out of 50 trials), while all other agents achieve 100% success. In the third table (`int_upper_limit=100000`), Agent_8 shows a significantly lower success rate of 56.00% (28 out of 50 trials), and agent_equal_attention has 98.00% success (49 out of 50). Agents 9 and 10 consistently show much higher Mean and Max values compared to other agents across all tables. Notable text includes "Maayan and Jonathan," possibly indicating the researchers. A Hebrew comment at the bottom reads, "Okay, this is not yet enough for statistical proof, I also need to check why Agent 8 fails there and ask myself if I need to generate different input every time or not (currently it's fixed input for each table) - but I would say a winning trend is being created here." This suggests an ongoing analysis and a critical look at the results, particularly Agent 8's performance. The Hebrew text provides a strong location cue to Israel.

Loading AttnAds…

transactions
revenues
stakers
Earliest
Latest
Highest stake

No transactions found

More from this user

More from Tel Aviv-Yafo

Nypple

Feb 13, 2025, 4:57 PM

Tel Aviv-Yafo, Israel

Licensed under Creative Commons Attribution 4.0 International License. You are free to share and adapt this content with proper attribution.