
Stake attention in this memory
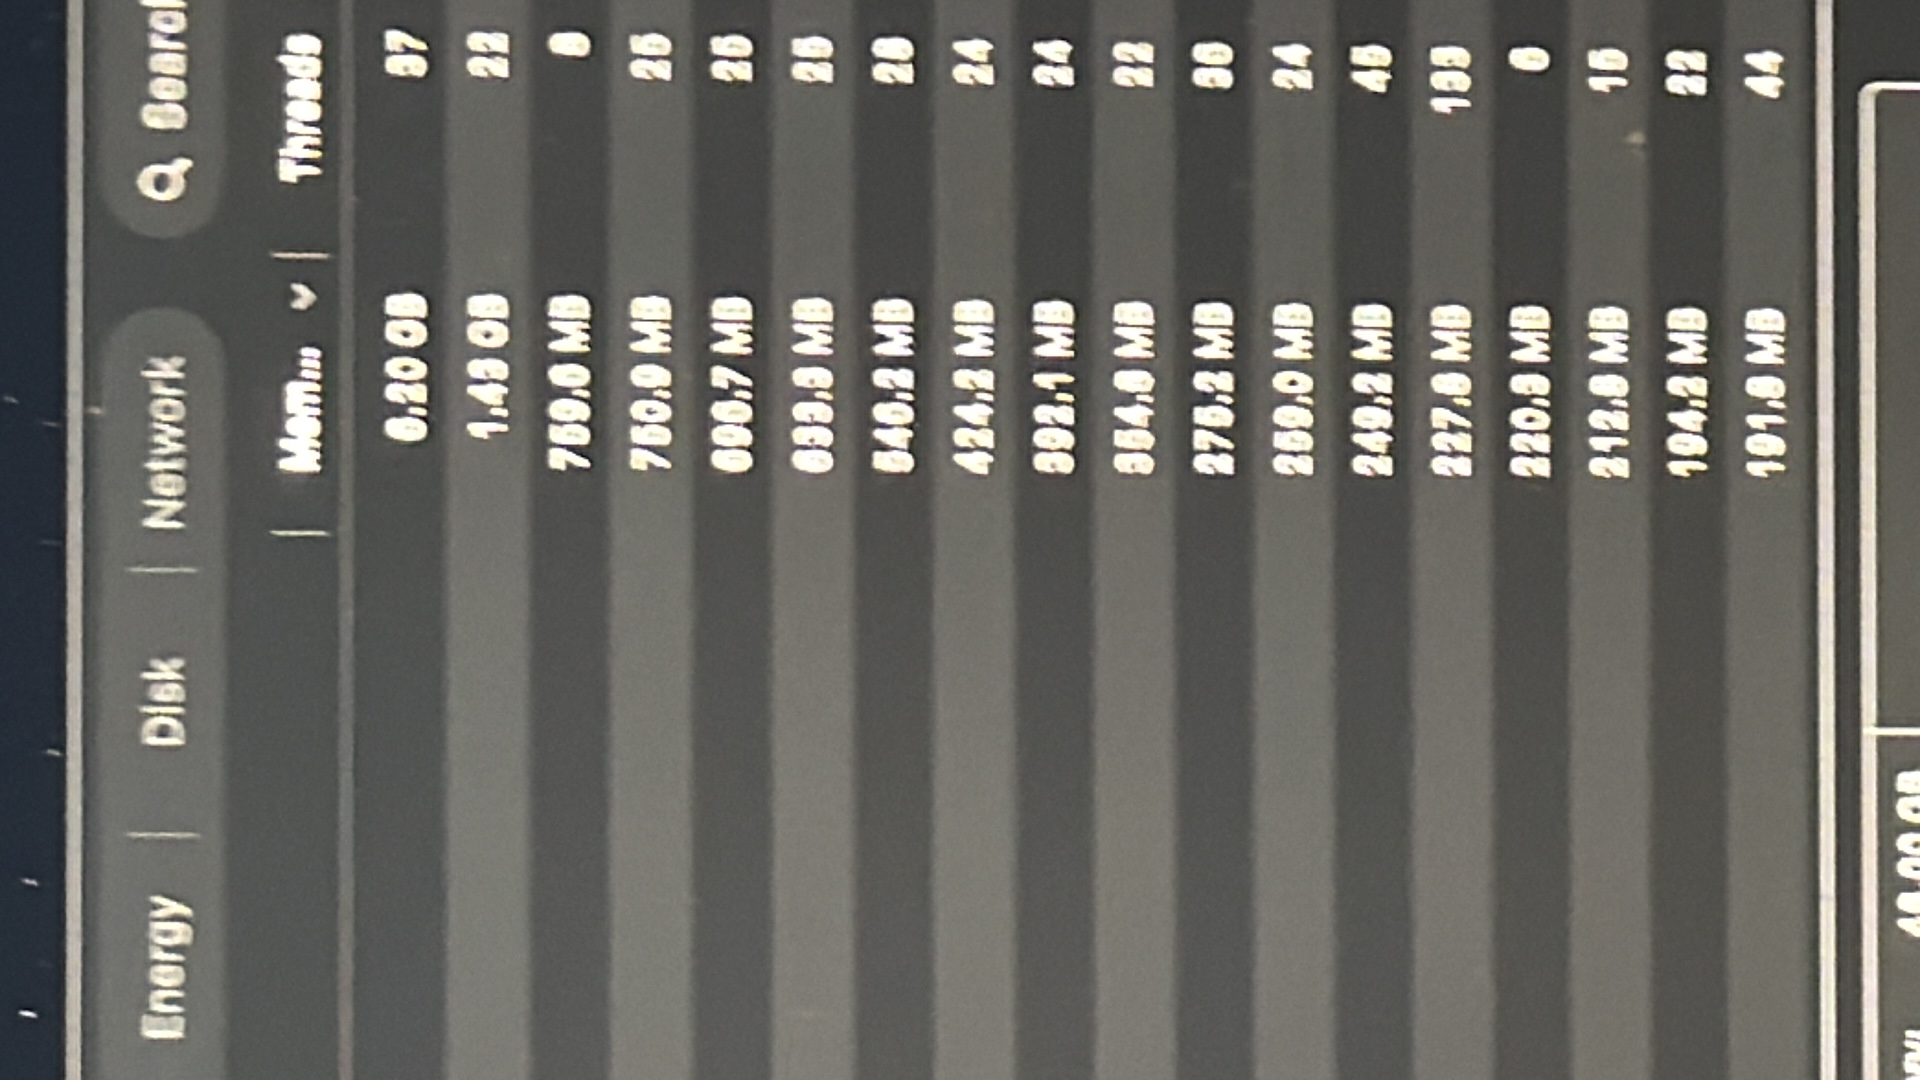
The image shows a screenshot of a computer's Activity Monitor application, displaying system performance data. The visible columns include "Energy", "Disk", "Network", "Mem...", and "Threads". The "Mem..." column shows memory usage in GB and MB, with values ranging from 1.43 GB down to 191.8 MB. The "Threads" column shows the number of threads, with values varying from 0 to 135. The background is a dark gray, with alternating lighter gray horizontal lines representing rows of data. The top of the screen shows the application's title bar with menu options like "Energy", "Disk", "Network", and a search icon. The image does not contain any information or context related to the city of Kafr Yasif, Israel.
Loading AttnAds…
No transactions found