
Mar 9, 2026, 8:54 AM
Stake attention in this memory
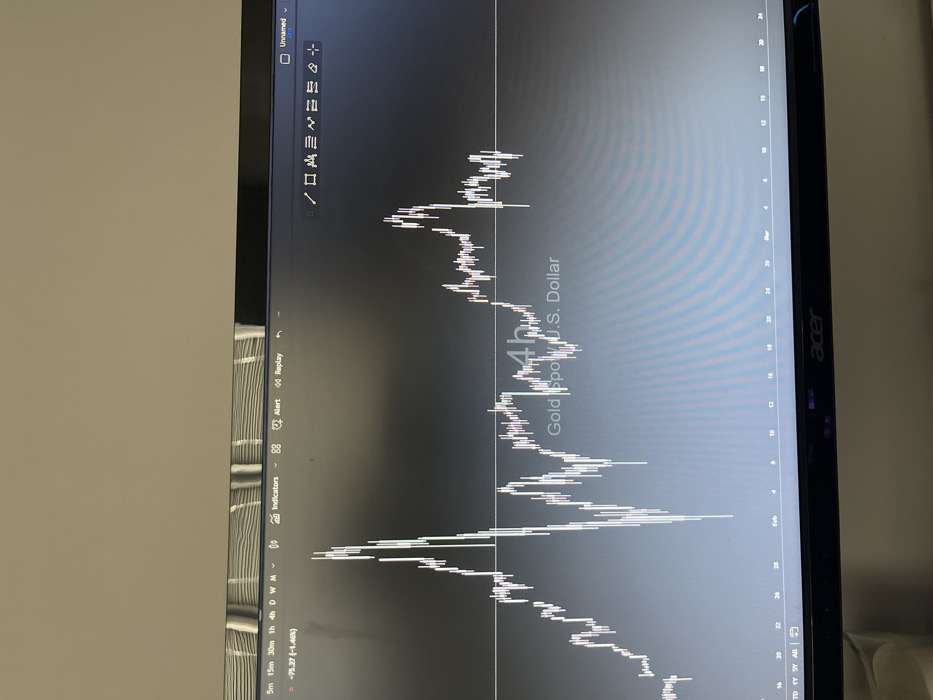
An Acer computer monitor displays a financial trading chart against a dark grey background. The chart, depicting "Gold spot U.S. Dollar" on a "4h" (4-hour) timeframe, shows price movements visualized with white vertical lines forming a line graph or outline of candlesticks. A horizontal white line dissects the chart, acting as a potential price level indicator. The top of the screen displays control options including timeframes, "Indicators," "Alert," "Replay," and various drawing tools. A percentage change of "-75.27 (-1.46%)" is visible in the upper left. Date markers along the bottom axis indicate periods including February and March. Reflections of horizontal blinds or a similar patterned surface are visible across the upper portion of the monitor screen. The monitor is positioned indoors against a plain, light-colored wall. A small portion of a white object is visible at the bottom left, adjacent to the monitor's stand. No individuals are present in the scene. The location is an indoor setting in Unknown, Unknown.
Symbol
66FB5
Volume
11,550
Creator
+$0.03
Revenue
+$0.00
TVL
$2.67
Loading AttnAds…


More from this user