
Stake attention in this memory
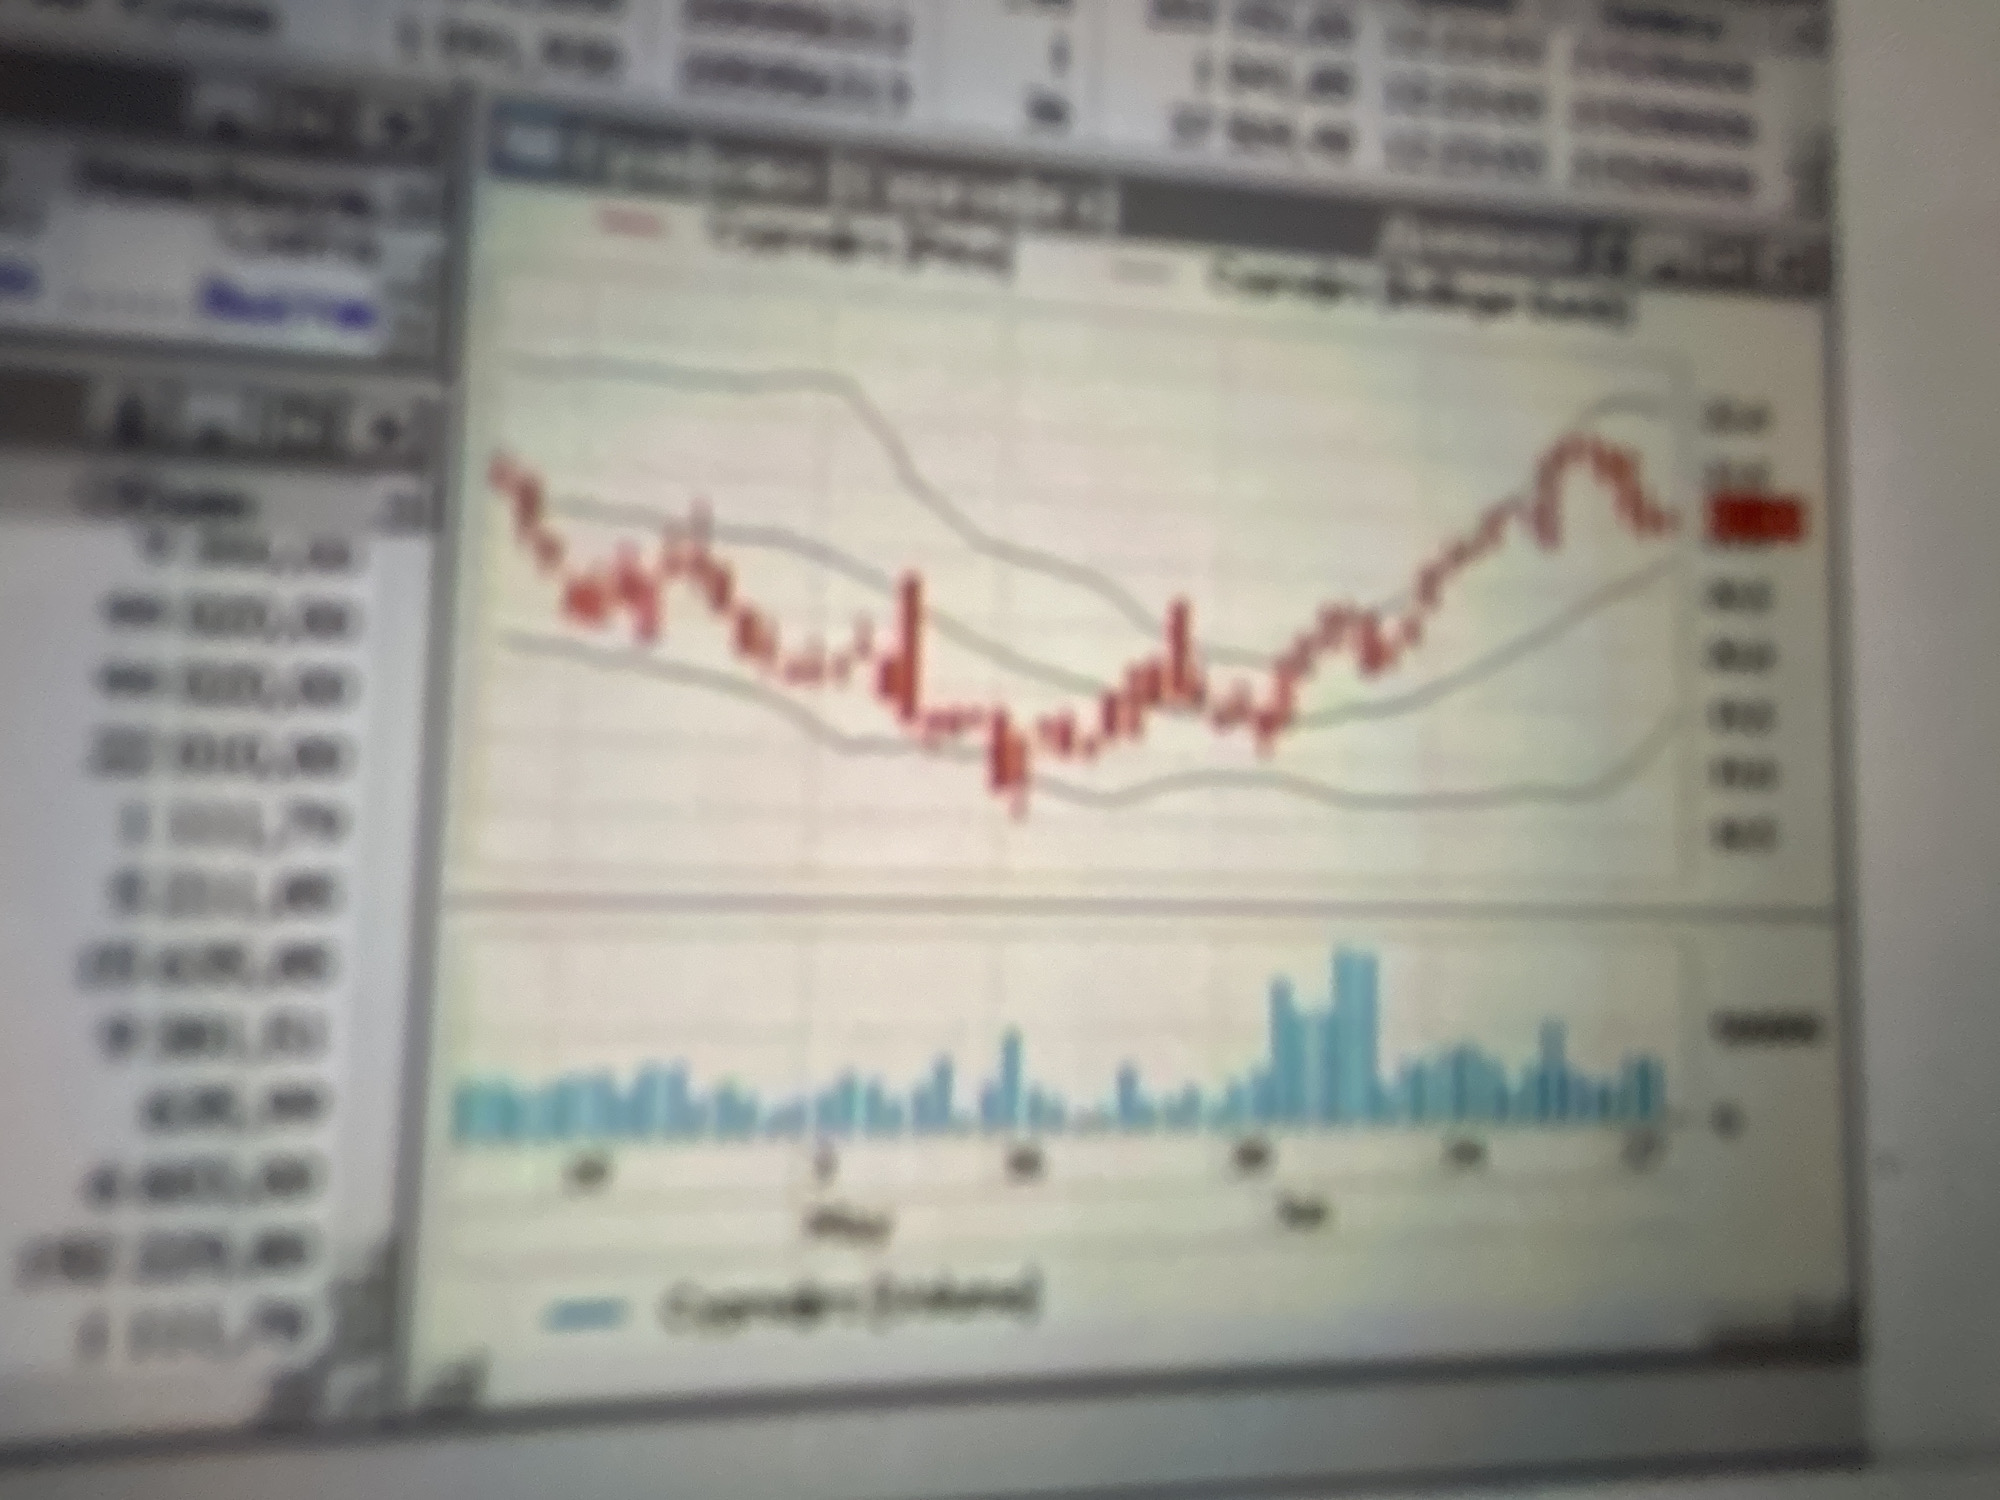
The image shows a computer screen displaying a financial chart. The chart features a red line graph, likely representing stock prices, fluctuating over time. Two gray lines are present above and below the red line, possibly indicating Bollinger Bands or trading ranges. Below the main chart, there is a bar graph, which could represent trading volume. The screen is split into multiple panes, with some text and numbers visible on the left side, though they are too blurry to read clearly. The top of the screen shows what appears to be menu or data headers. The overall scene suggests a user is monitoring financial markets on a computer. There are no people visible in the image. The lighting appears to be artificial, consistent with indoor use of a computer. The location context "Gelendzhik, Russia" is provided but has no direct visual cues within the image itself. No specific time of day or weather conditions can be determined.
Loading AttnAds…
No transactions found