Stake attention in this memory
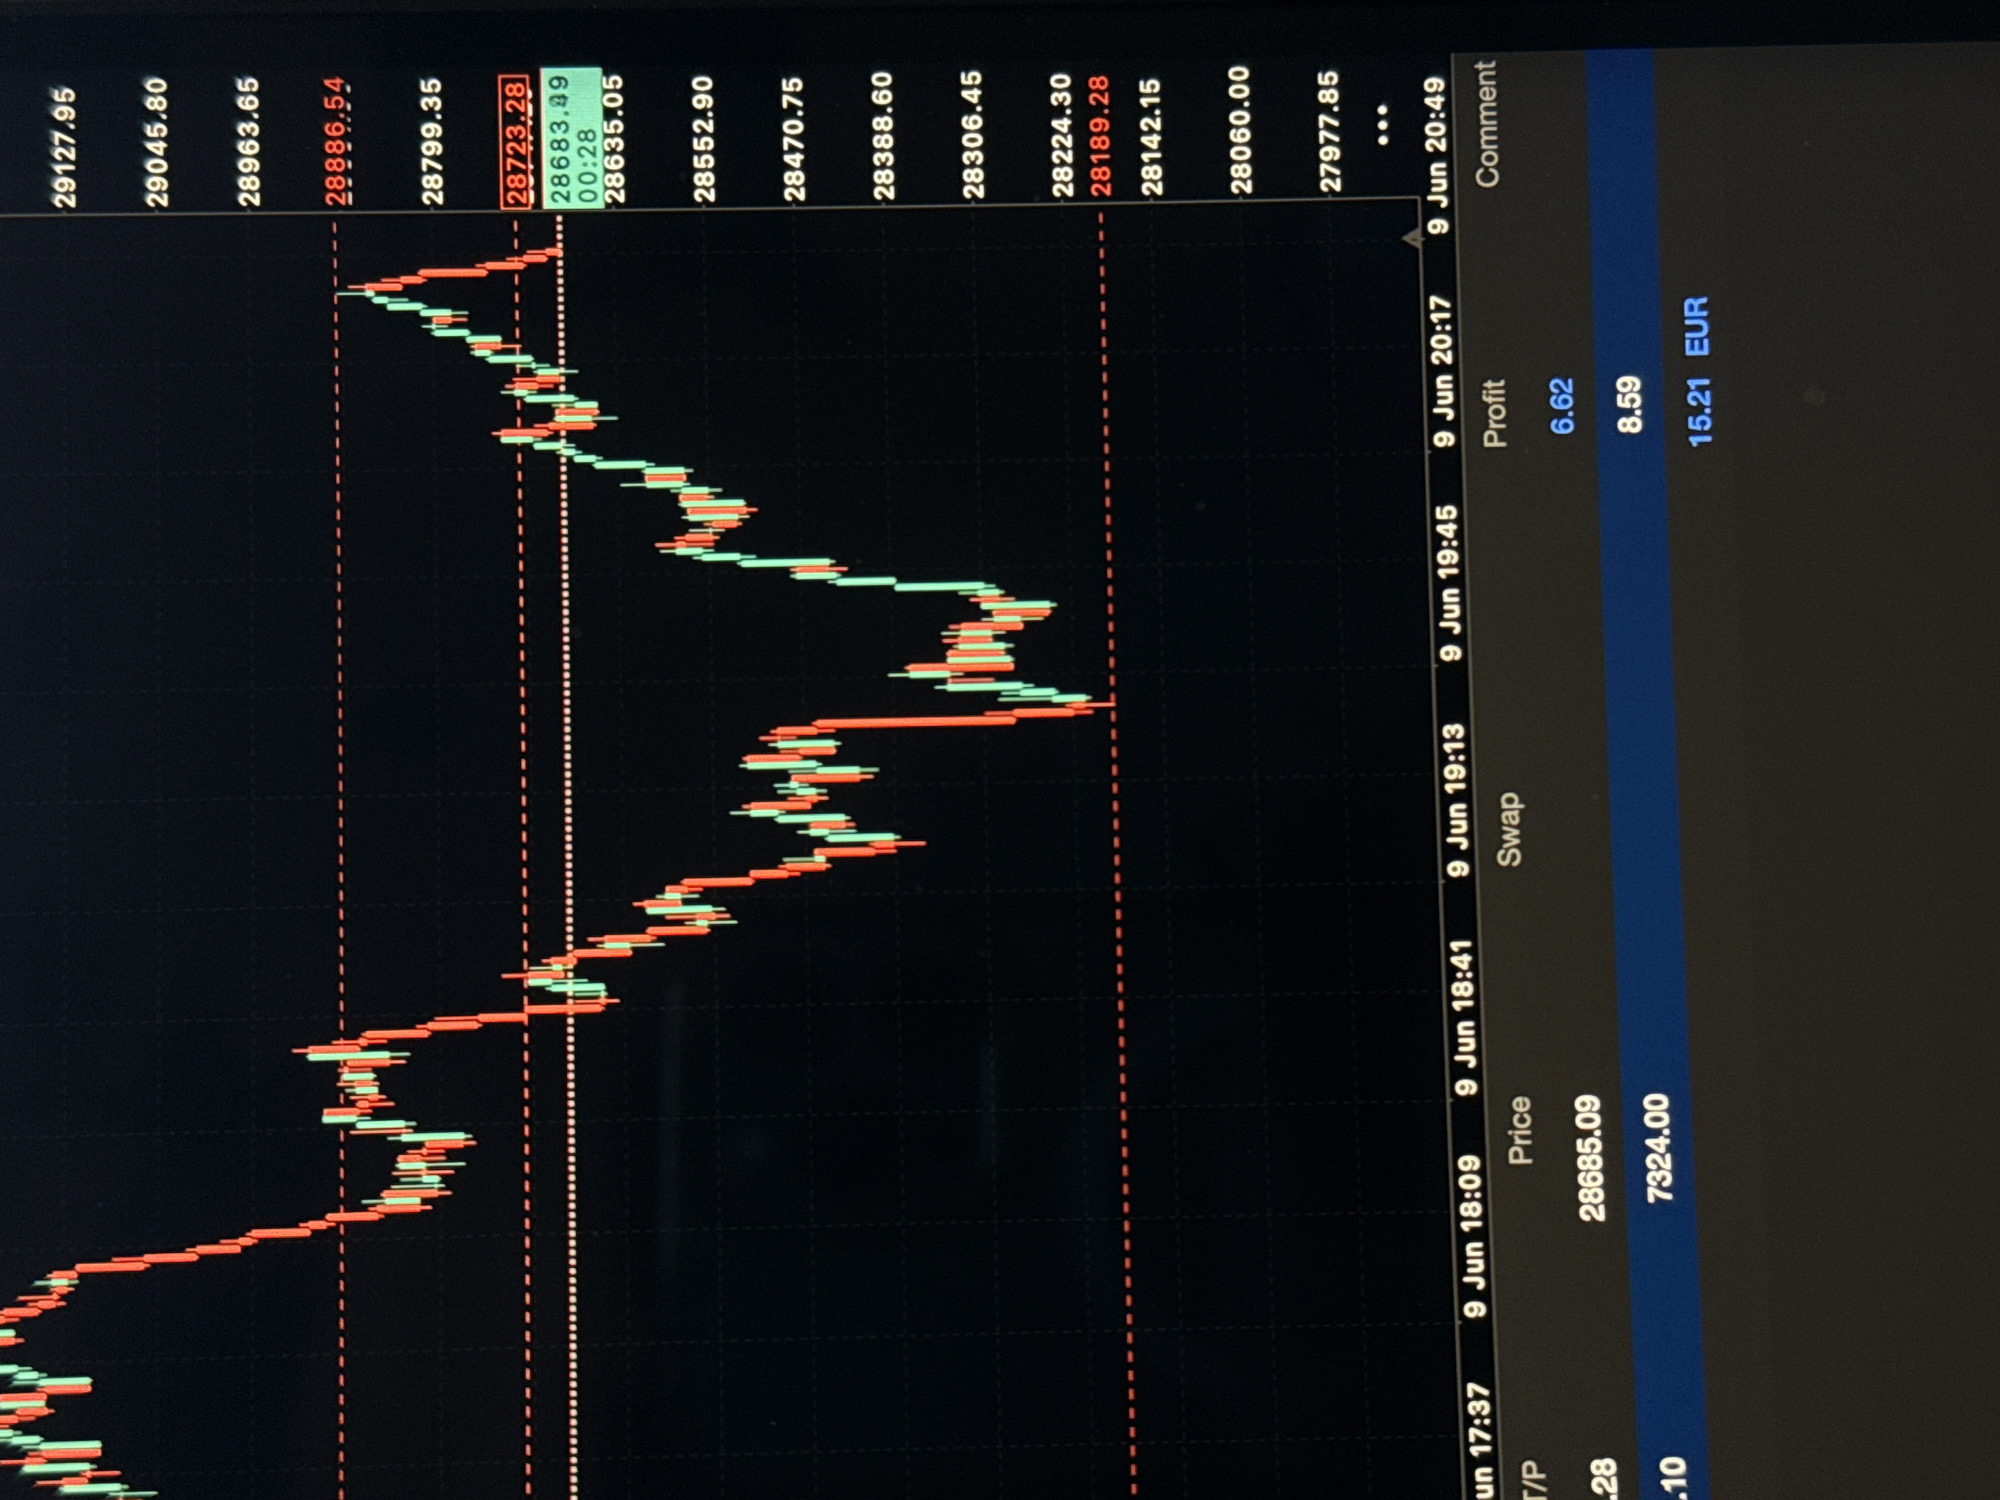
The image displays a close-up of a computer monitor showing a financial trading chart, likely for cryptocurrency or stocks, with a table of trade data at the bottom. The chart features candlestick patterns in red and green, indicating price fluctuations over time, with horizontal lines representing price levels. The table below shows columns for date and time, price, profit, and comments. Specific visible data points include dates like "9 Jun 17:37" and prices such as "28685.09" and "7324.00", along with profits like "6.62" and "8.59". The overall environment appears to be indoors, given the context of a monitor display, but there are no elements to suggest a specific location within Delmenhorst, Germany.
No transactions found