Stake attention in this memory
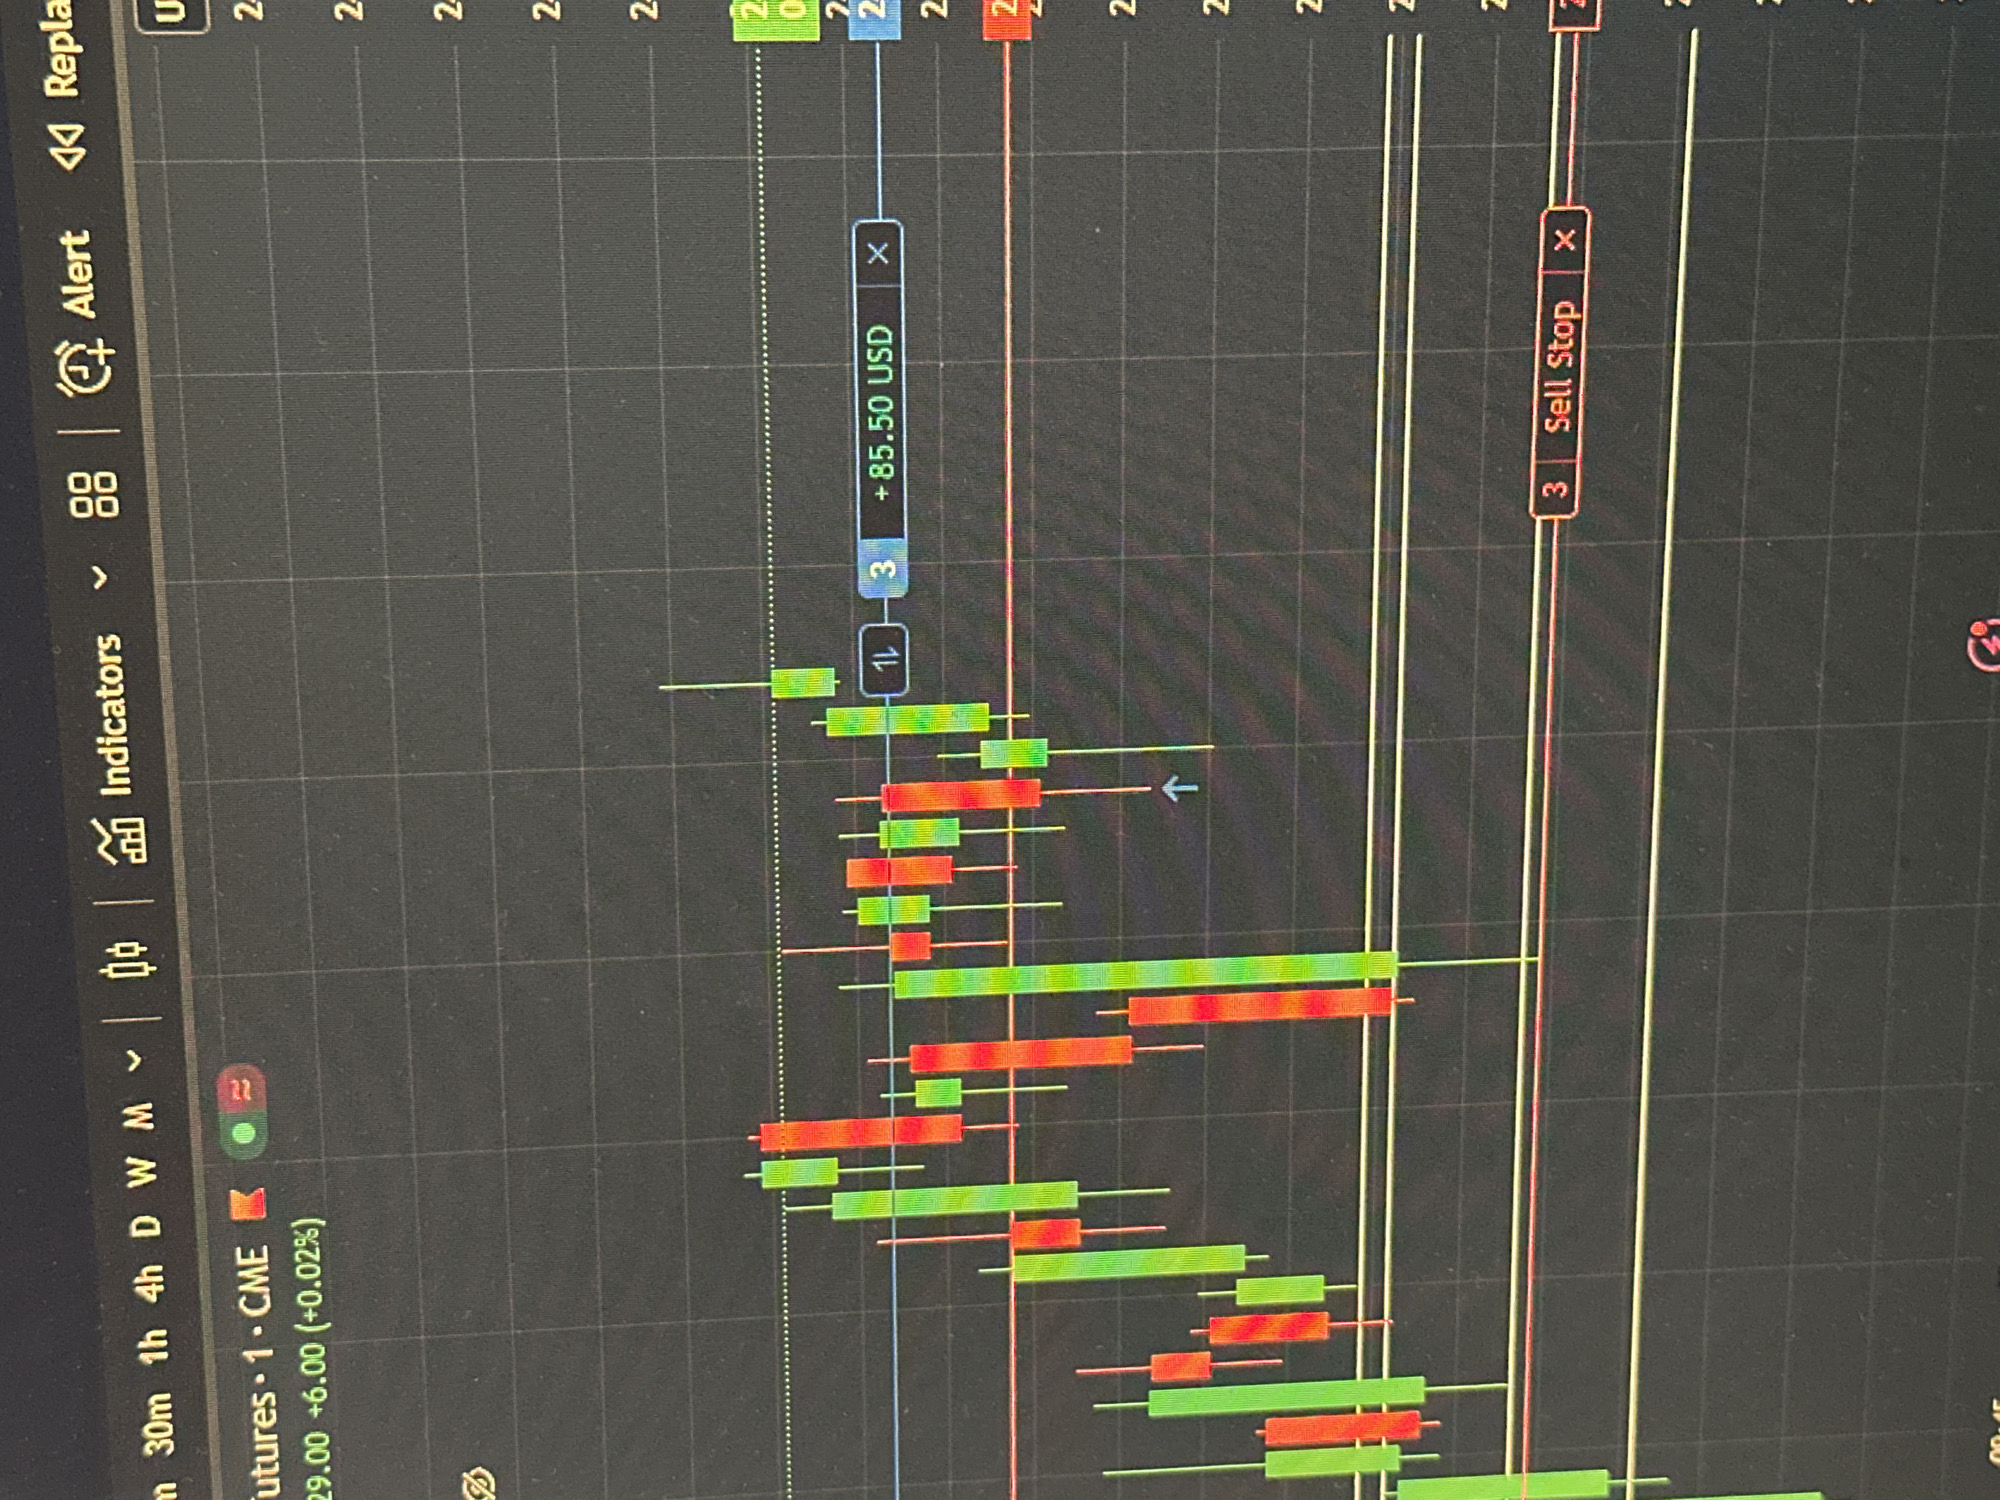
The image displays a digital financial trading interface on a screen, presumed to be located in Sofia, Bulgaria. The primary subject is a candlestick chart rendered on a dark gray background with a lighter gray grid. **Subjects and Objects:** * **Digital Display:** A screen showing a financial trading platform. * **Candlestick Chart:** Dominated by numerous red and green candlesticks, representing price movements over time. Green candles indicate upward price movement, while red candles indicate downward movement. Most candles feature vertical wicks extending from their bodies. * **Grid Lines:** Horizontal and vertical grid lines provide a structured background for the chart. * **Text and Data:** * Top left: Timeframe options ("30m 1h 4h D W M"), asset identification ("Futures 1 CME"), and current price/change data ("29.00 +6.00 (+0.02%)"). * Top center: Menu options and icons including "Indicators," chart type selections, "Alert," and "Repla" (likely "Replay"). * Right side: Partial numeric labels for the vertical price axis (e.g., "2.4", "2.2", "2.0"). * **Trade Indicators:** * A horizontal blue line with a label box containing "1L", "3", and "+85.50 USD", suggesting an active long position with a realized or unrealized profit. * A horizontal red line near the bottom with a label box containing "3", "Sell Stop", indicating a pending stop-loss order for a sell position. * Multiple horizontal yellow lines, possibly representing support/resistance levels or other technical indicators. * A small upward-pointing arrow positioned below a green candlestick, potentially marking an entry point or a specific event. **Actions and Interactions:** The image itself depicts a static display of financial data and pending orders. No explicit actions or interactions by individuals are visible within the captured scene. The elements suggest a user has placed trades and is monitoring market activity. **Environment:** The environment depicted is entirely digital, consisting solely of the financial trading interface. There are no people, physical objects, or external environmental details from Sofia, Bulgaria, visible within the image frame. The location information for Sofia, Bulgaria, pertains to the presumed physical location from which this digital screenshot was captured or displayed.
No transactions found