Stake attention in this memory
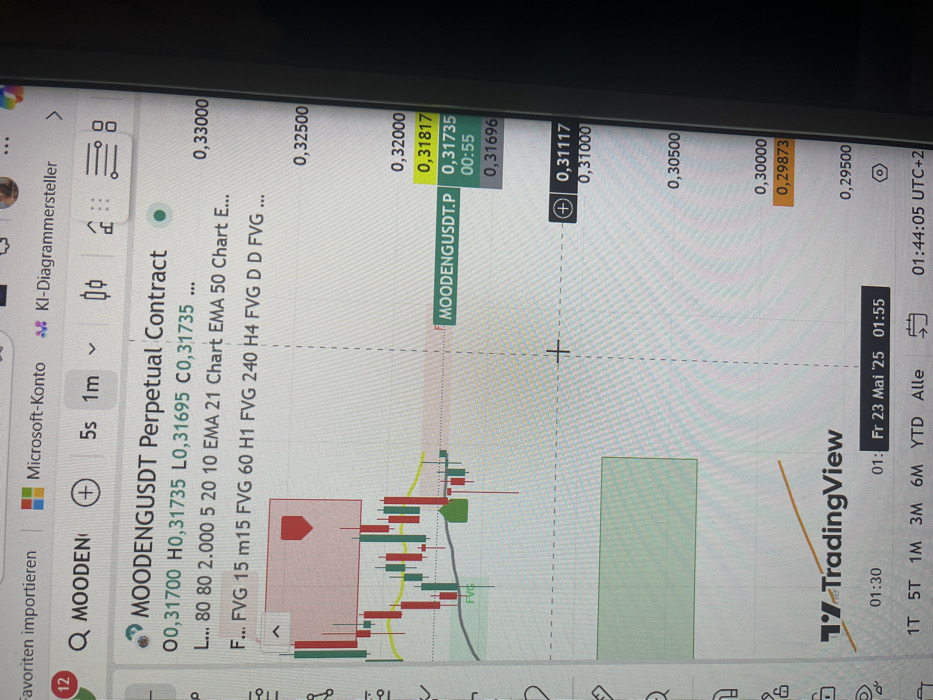
The image shows a computer screen displaying a financial trading chart for the MOODENUSDT perpetual contract on the TradingView platform. The chart is set to a 5-second timeframe and shows price fluctuations over a period of time. The current price is 0.31735, and the chart shows recent price movements, including a significant drop in price around 0.32000. The chart is a candlestick chart, with green candles representing periods of price increases and red candles representing periods of price decreases. The image is likely from Karlsruhe, Germany, as the coordinates provided (48.99, 8.381) place it in the city. The timestamp on the chart indicates it is Friday, May 23rd, at 01:55. The user appears to be monitoring the price movements of the MOODENUSDT perpetual contract.
No transactions found
More from this user
More from Karlsruhe

