Stake attention in this memory
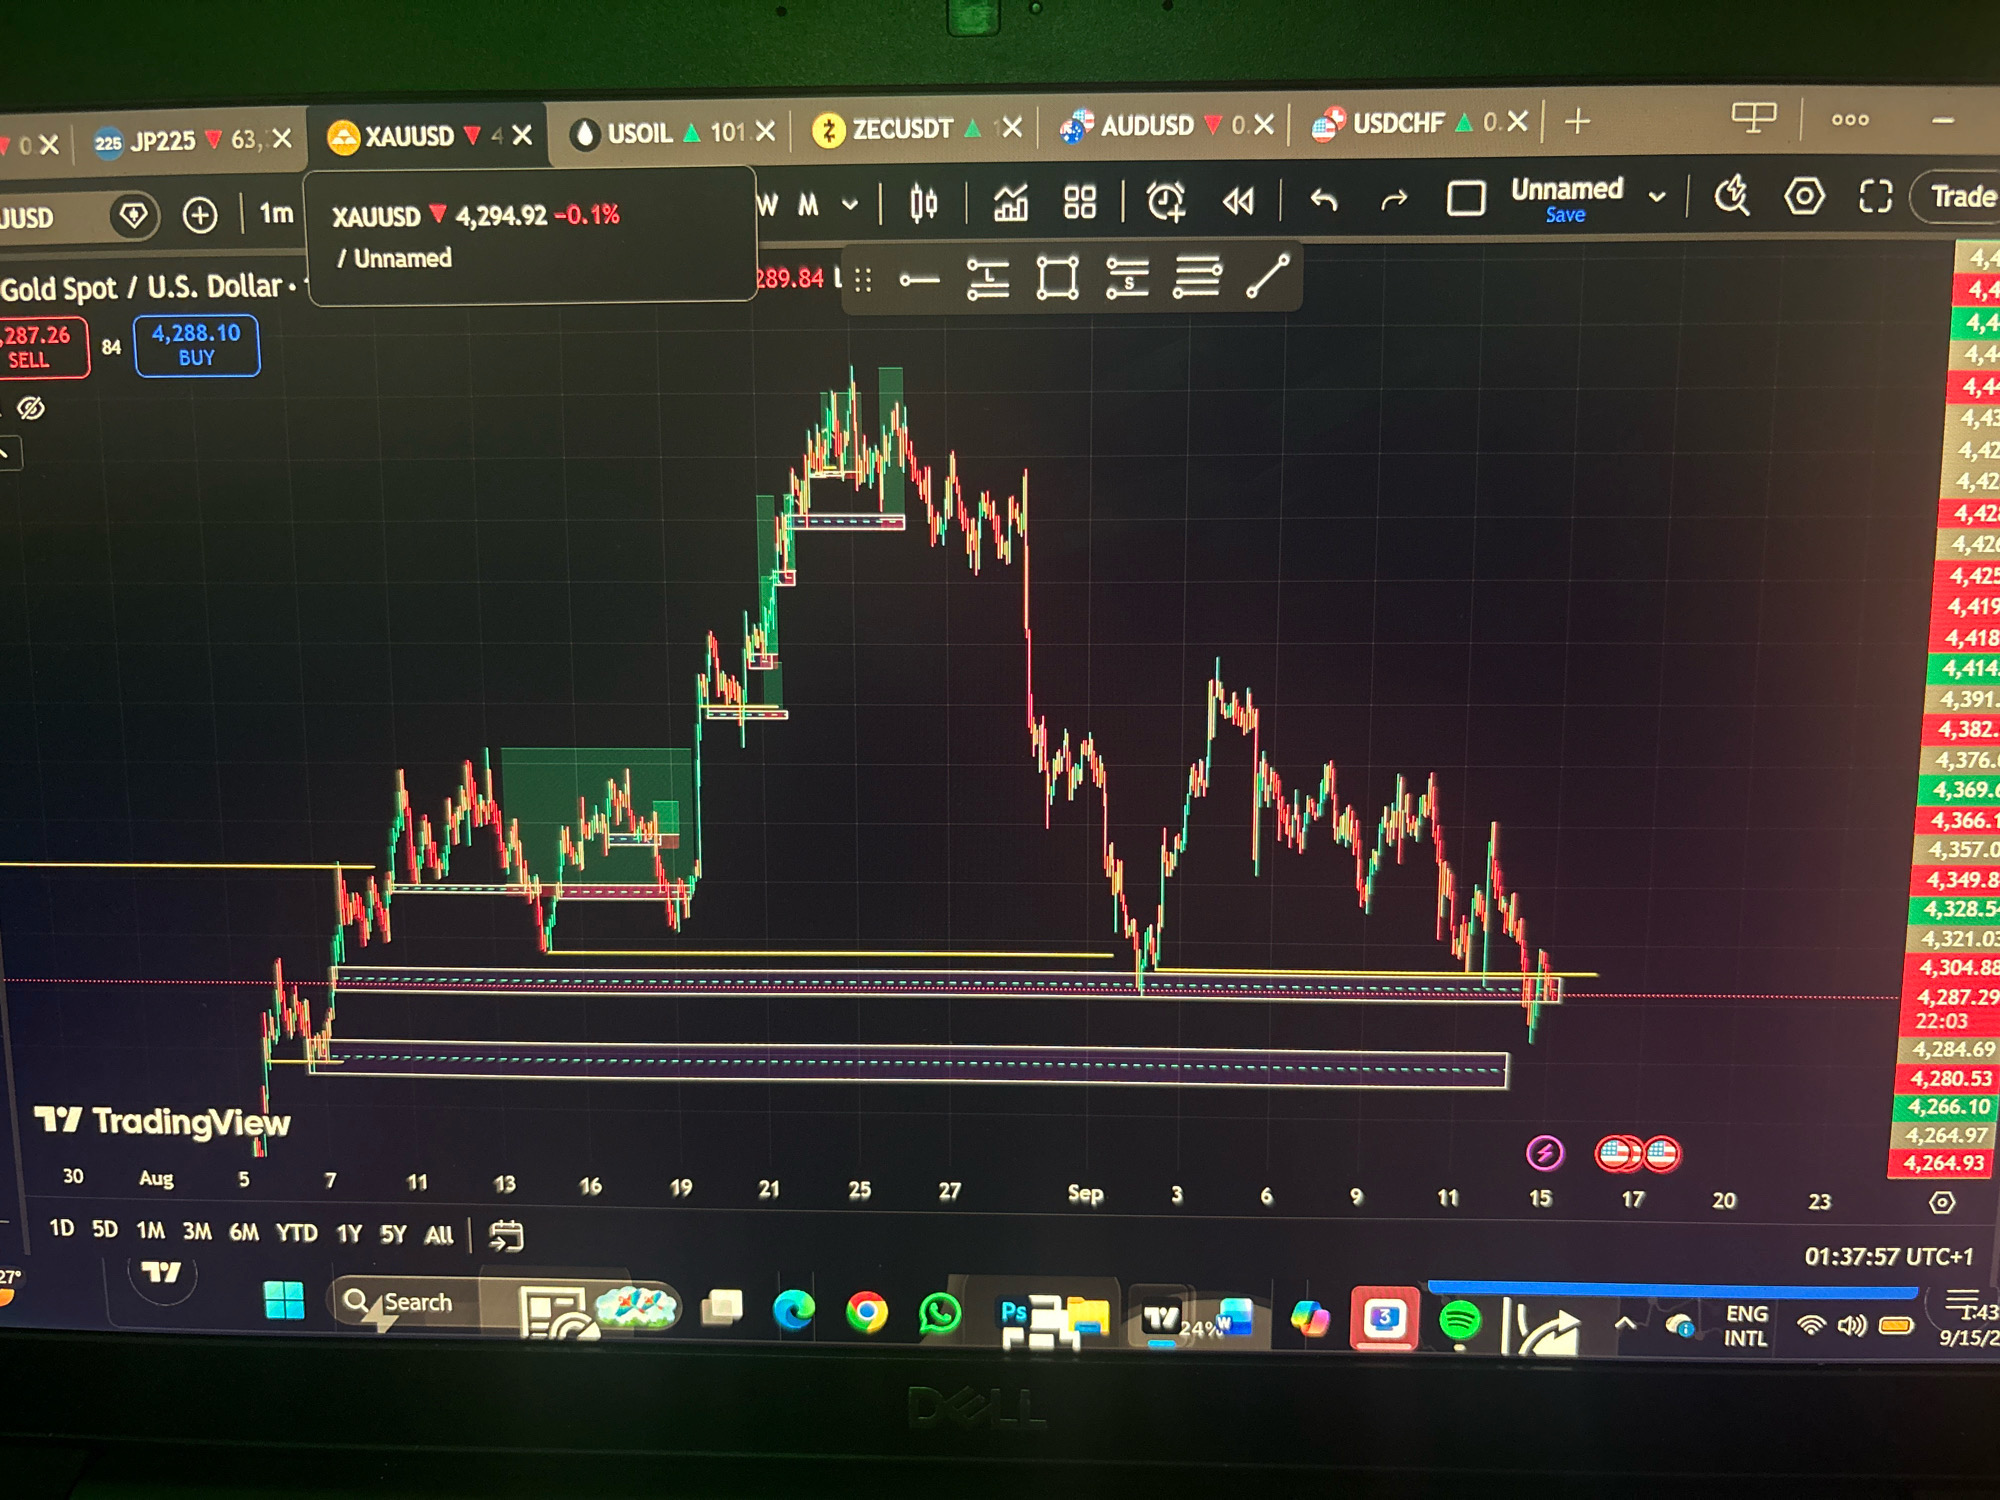
The image is a screenshot of a trading platform, likely TradingView, displaying a financial chart. The chart shows candlestick patterns, indicating price movements over time for "Gold Spot / U.S. Dollar." Various trading indicators and price levels are superimposed on the chart, including buy and sell zones marked with colored boxes. The date range displayed on the x-axis spans from late August to early September. The top of the screen shows a series of tabs for different trading instruments and market data, such as "XAUUSD," "USOIL," and "AUDUSD." The bottom of the screen displays system information like time and date, and icons for various applications. There are no people visible in the image. The scene is entirely digital and does not depict any physical location in a city.
Loading AttnAds…
No transactions found