Stake attention in this memory
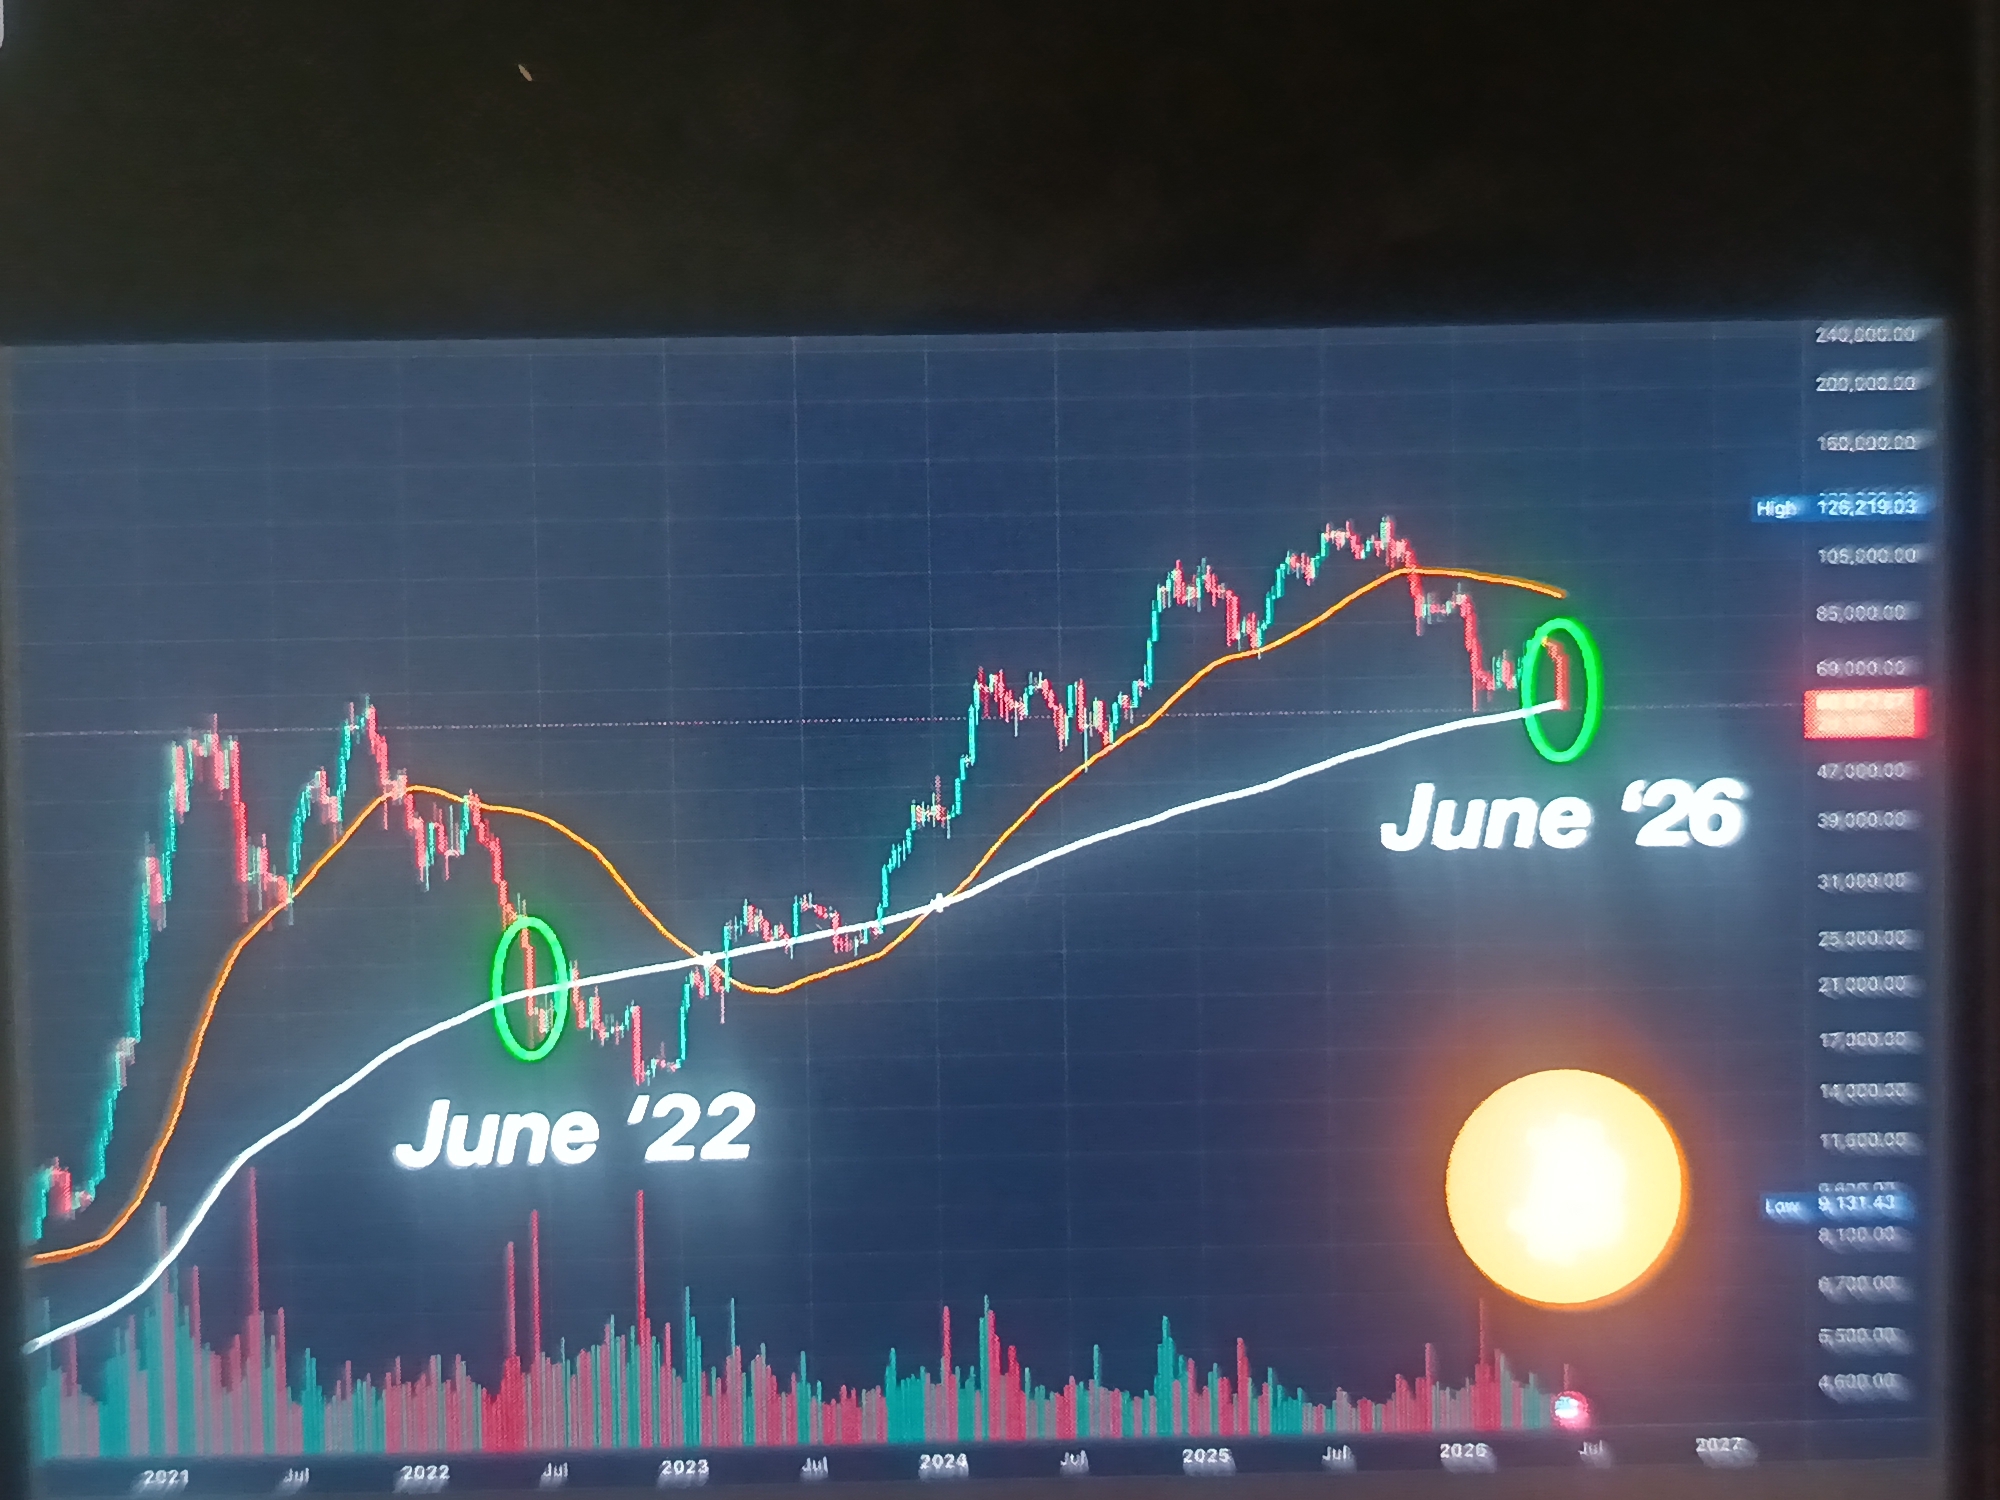
The image displays a digital screen presenting a financial candlestick chart on a dark background. The chart spans horizontally from early 2021 to late 2027, with vertical price axis values ranging logarithmically from 4,000.00 to 240,000.00. Candlesticks, colored primarily red and teal/light green, illustrate market price movements. Two distinct moving average lines are overlaid: a shorter-term orange line closely tracking the candlesticks, and a longer-term white line indicating a broader trend. Volume bars, colored red and green, are situated along the bottom of the chart. Specific areas of interest are highlighted with green circular annotations: one around a set of red candlesticks corresponding to "June '22" on the timeline, and another around a single red candlestick corresponding to "June '26." Text labels "June '22" and "June '26" are prominently displayed near their respective highlights. A luminous, circular, yellow-orange glow, resembling a sun or a strong light source, is present in the bottom-right quadrant of the screen, partially obscuring the volume bars in that area. Digital readouts on the right side indicate "High 126,219.03" and "Low 9,131.43." No human subjects are present in the image. The photograph exhibits reflections on the screen surface. The location is Unknown, Unknown.
Symbol
76966
Volume
10,967
Creator
+$0.04
Revenue
+$0.06
TVL
$2.95
Loading AttnAds…