
Stake attention in this memory
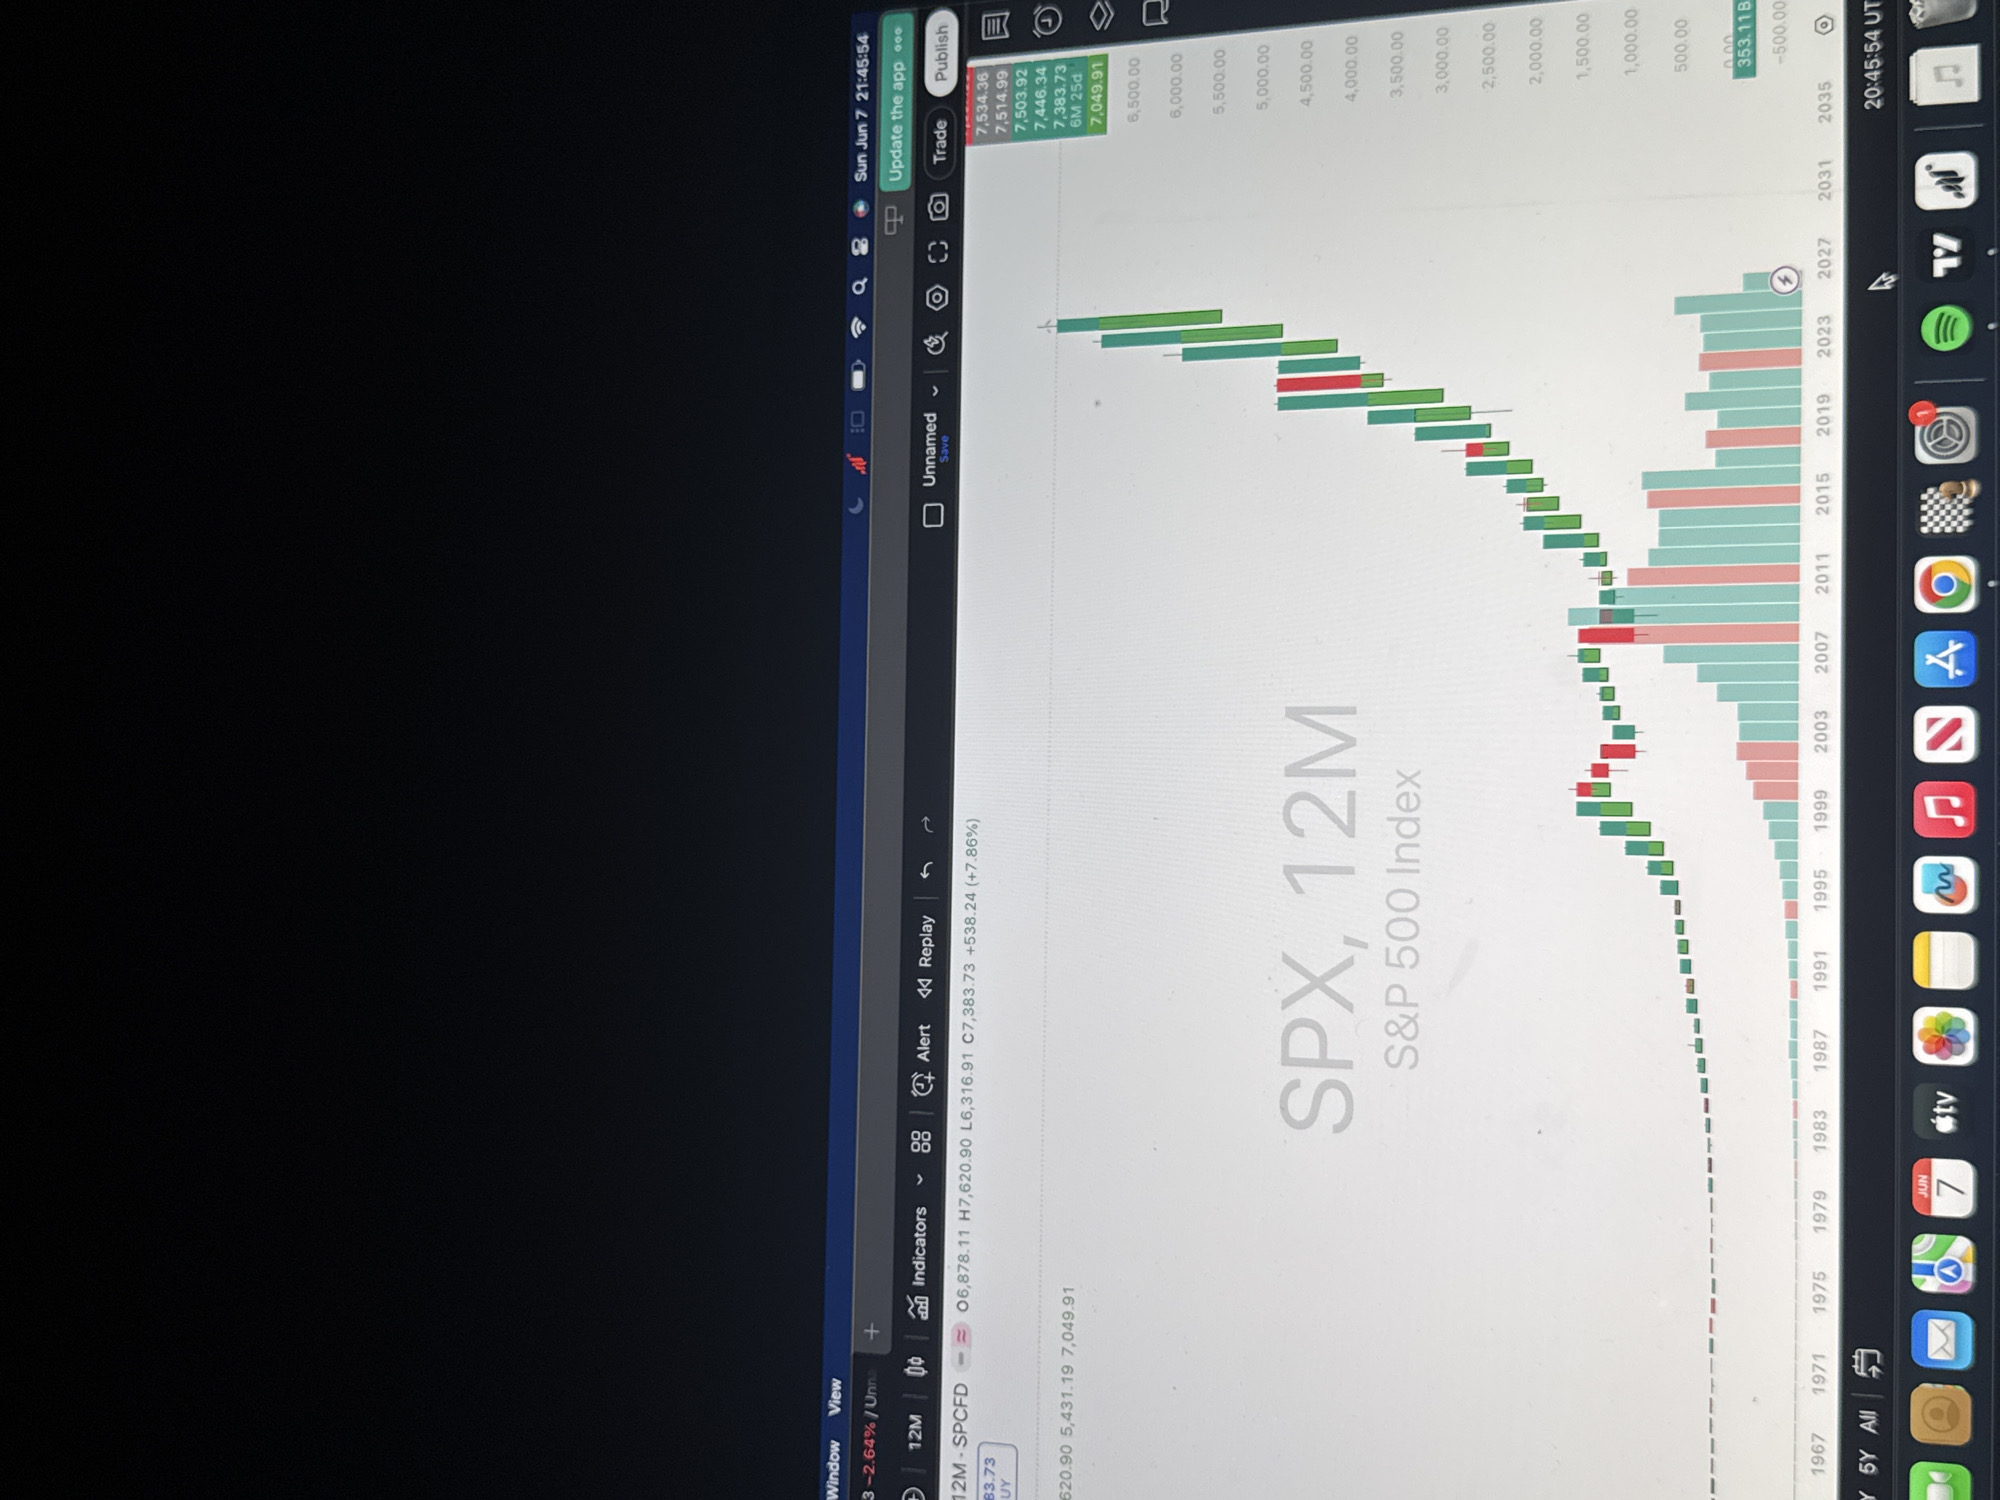
A detailed photograph captures a laptop screen displaying a financial charting application, likely TradingView, in a low-light indoor setting. The main subject is a candlestick chart for "SPX, 12M" (S&P 500 Index), showing historical data from approximately 1967 to 2027. Green candlesticks indicate upward price movements, while red ones denote downward movements, with a general upward trend visible over the decades, particularly from the mid-1990s. Volume bars, colored light blue and pink/red, are displayed below the price chart. At the top left of the screen, current or recent data points are visible: "O 6,878.11 H 7,620.90 L 6,316.91 C 7,383.73 +538.24 (+7.86%)". The application's interface includes options like "Indicators," "Alert," "Replay," "Trade," and "Publish." The system clock in the top right corner indicates "Sun Jun 7 21:45:54," with an "Update the app" button nearby. A vertical axis on the right side of the chart ranges from -500 to 7,500, marking price levels. Below the chart, the macOS dock is partially visible, showing icons for various applications such as Finder, Messages, Mail, Calendar, Safari, Chrome, Spotify, and Terminal. A red notification badge with the number '1' is present on the System Preferences icon. The bottom right of the dock also displays "20:45:54 UT." The surrounding environment is dark, with only the screen illuminating the immediate area, and some reflections are visible on the screen's surface.
Loading AttnAds…
No transactions found