Stake attention in this memory
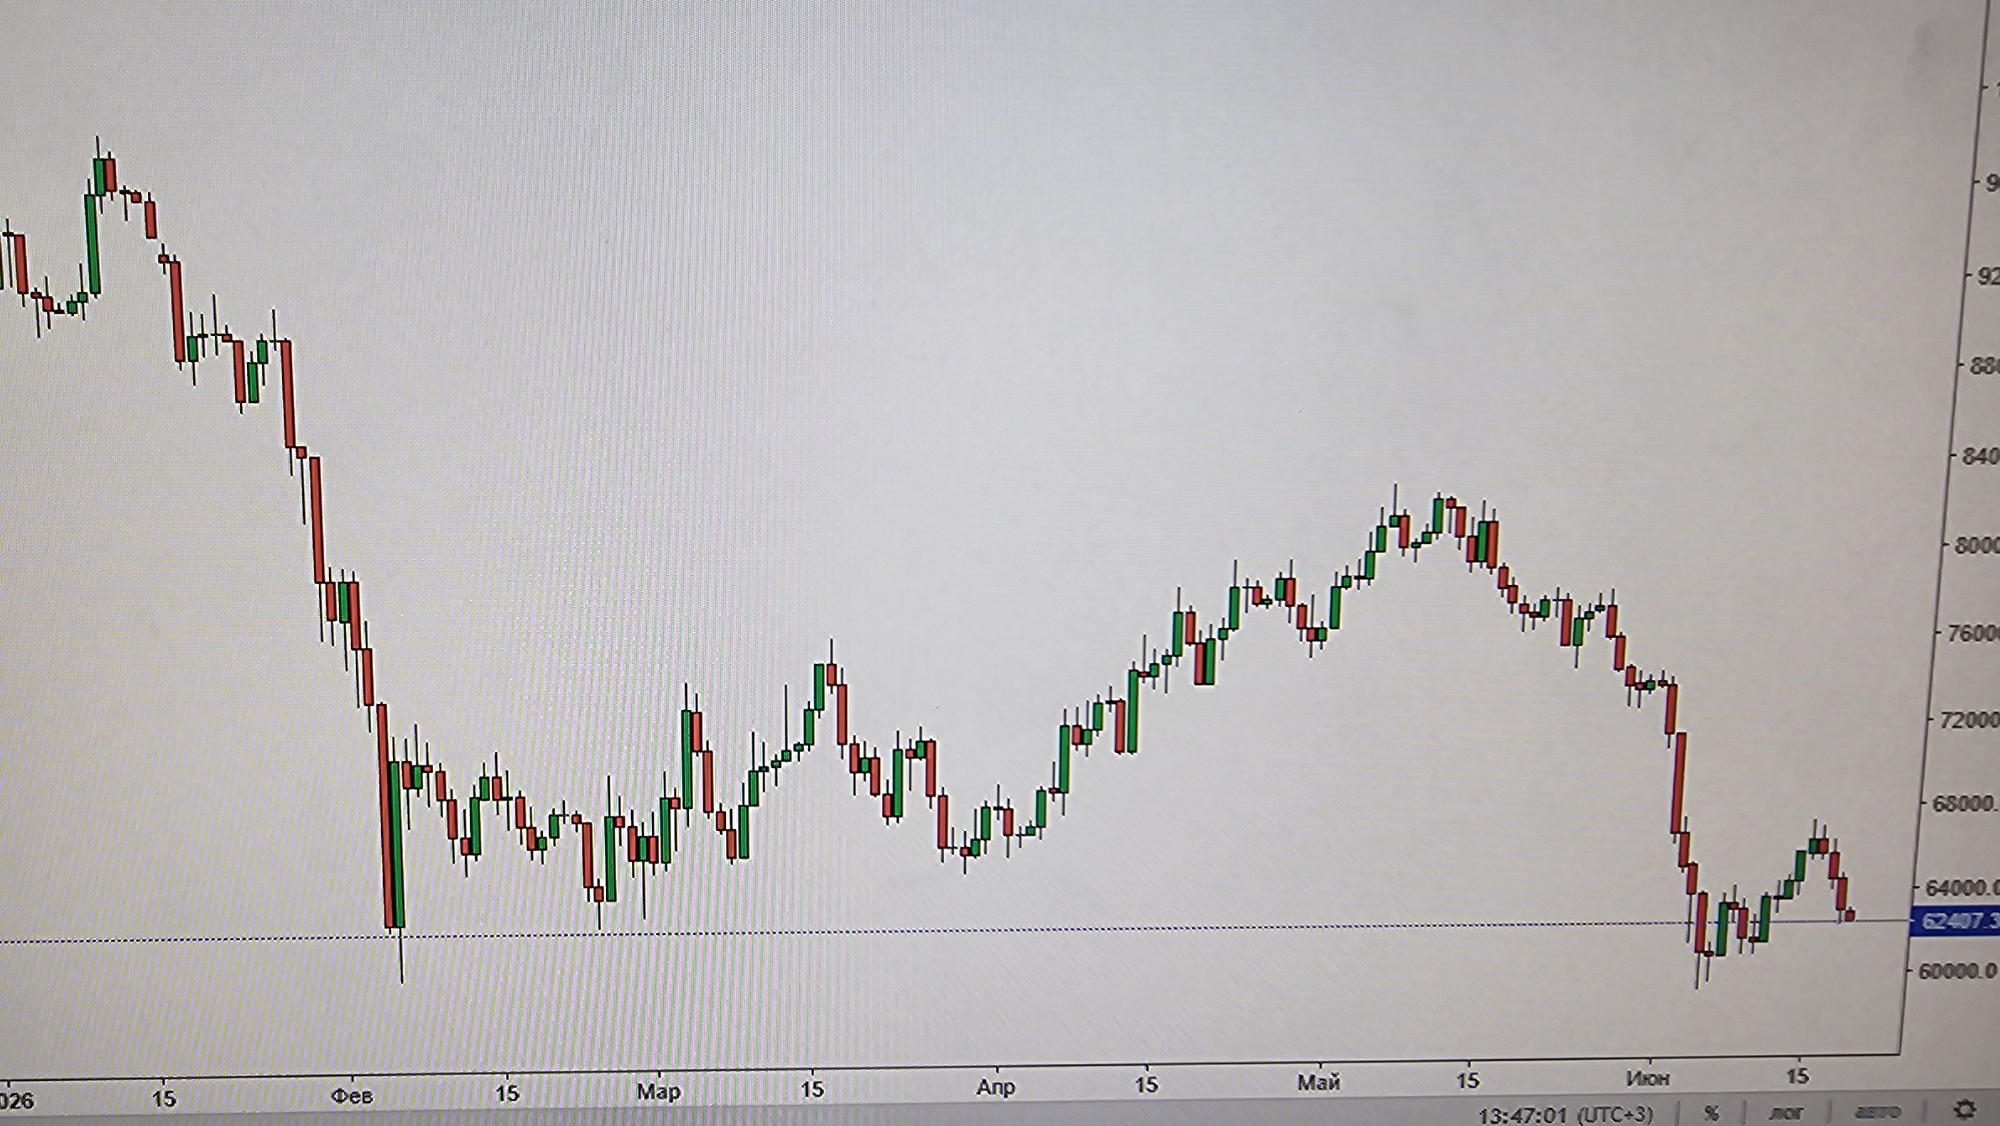
The image is a screenshot of a financial trading chart displayed on a computer screen. The chart shows candlestick patterns representing price movements over time, with red candles indicating a price decrease and green candles indicating a price increase. The horizontal axis displays dates and months (Фев, Маp, Anp, Май, Июн), and the vertical axis displays price values in increments of 4000 (e.g., 60000.0, 64000.0, 68000.0, etc.). The chart also shows a current price of 62407.3 at the time of the screenshot, with the time indicated as 13:47:01 (UTC+3). The background is a plain white or light gray, characteristic of a computer display. There are no people or any recognizable elements of the city of Ақсай қалалық әкімдігі, Kazakhstan visible in the image. The image is focused solely on the digital display of the financial chart.
No transactions found
More from this user

More from Ақсай қалалық әкімдігі