Stake attention in this memory
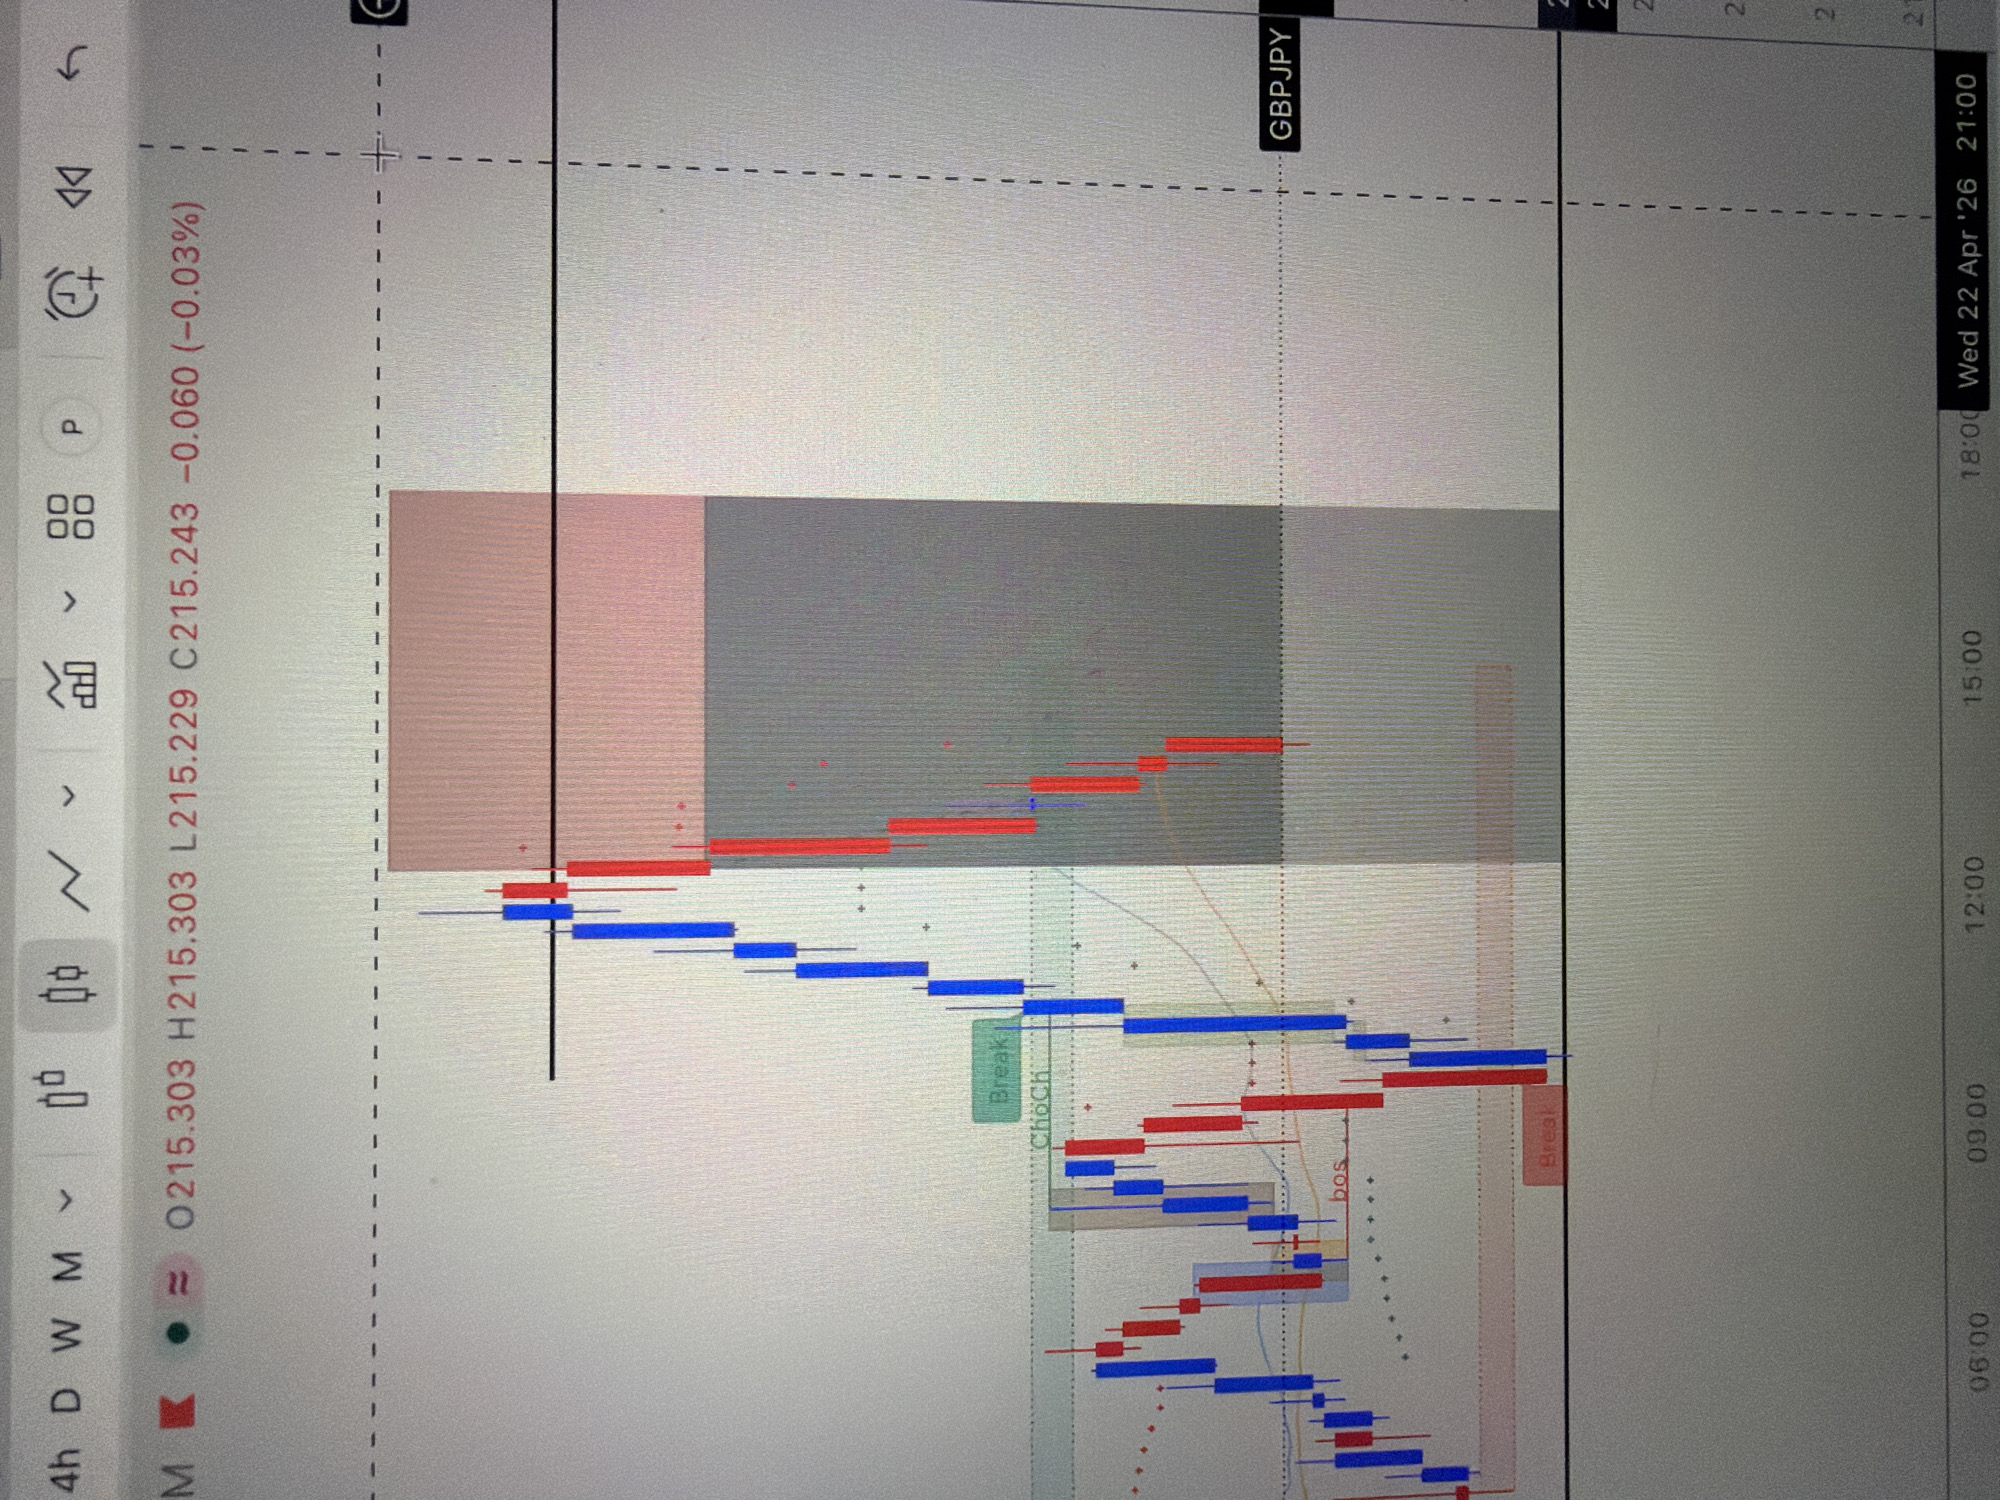
The image shows a screenshot of a trading chart for the currency pair GBP/JPY. The chart displays candlestick patterns, indicating price movements over time. The x-axis represents time, spanning from 06:00 to 21:00 on Wednesday, April 22, 2026. The y-axis represents the price of GBP/JPY. Red candlesticks indicate price decreases, while blue candlesticks indicate price increases. Labels like "bos" (break of structure) and "Choch" (change of character) are present, suggesting technical analysis markings. The top left shows the current price at C215.243, with a change of -0.060 (-0.03%). A time interval of 4 hours is selected. There are gray and red shaded areas indicating support and resistance. The image does not contain information about Plovdiv, Bulgaria.
No transactions found