Stake attention in this memory
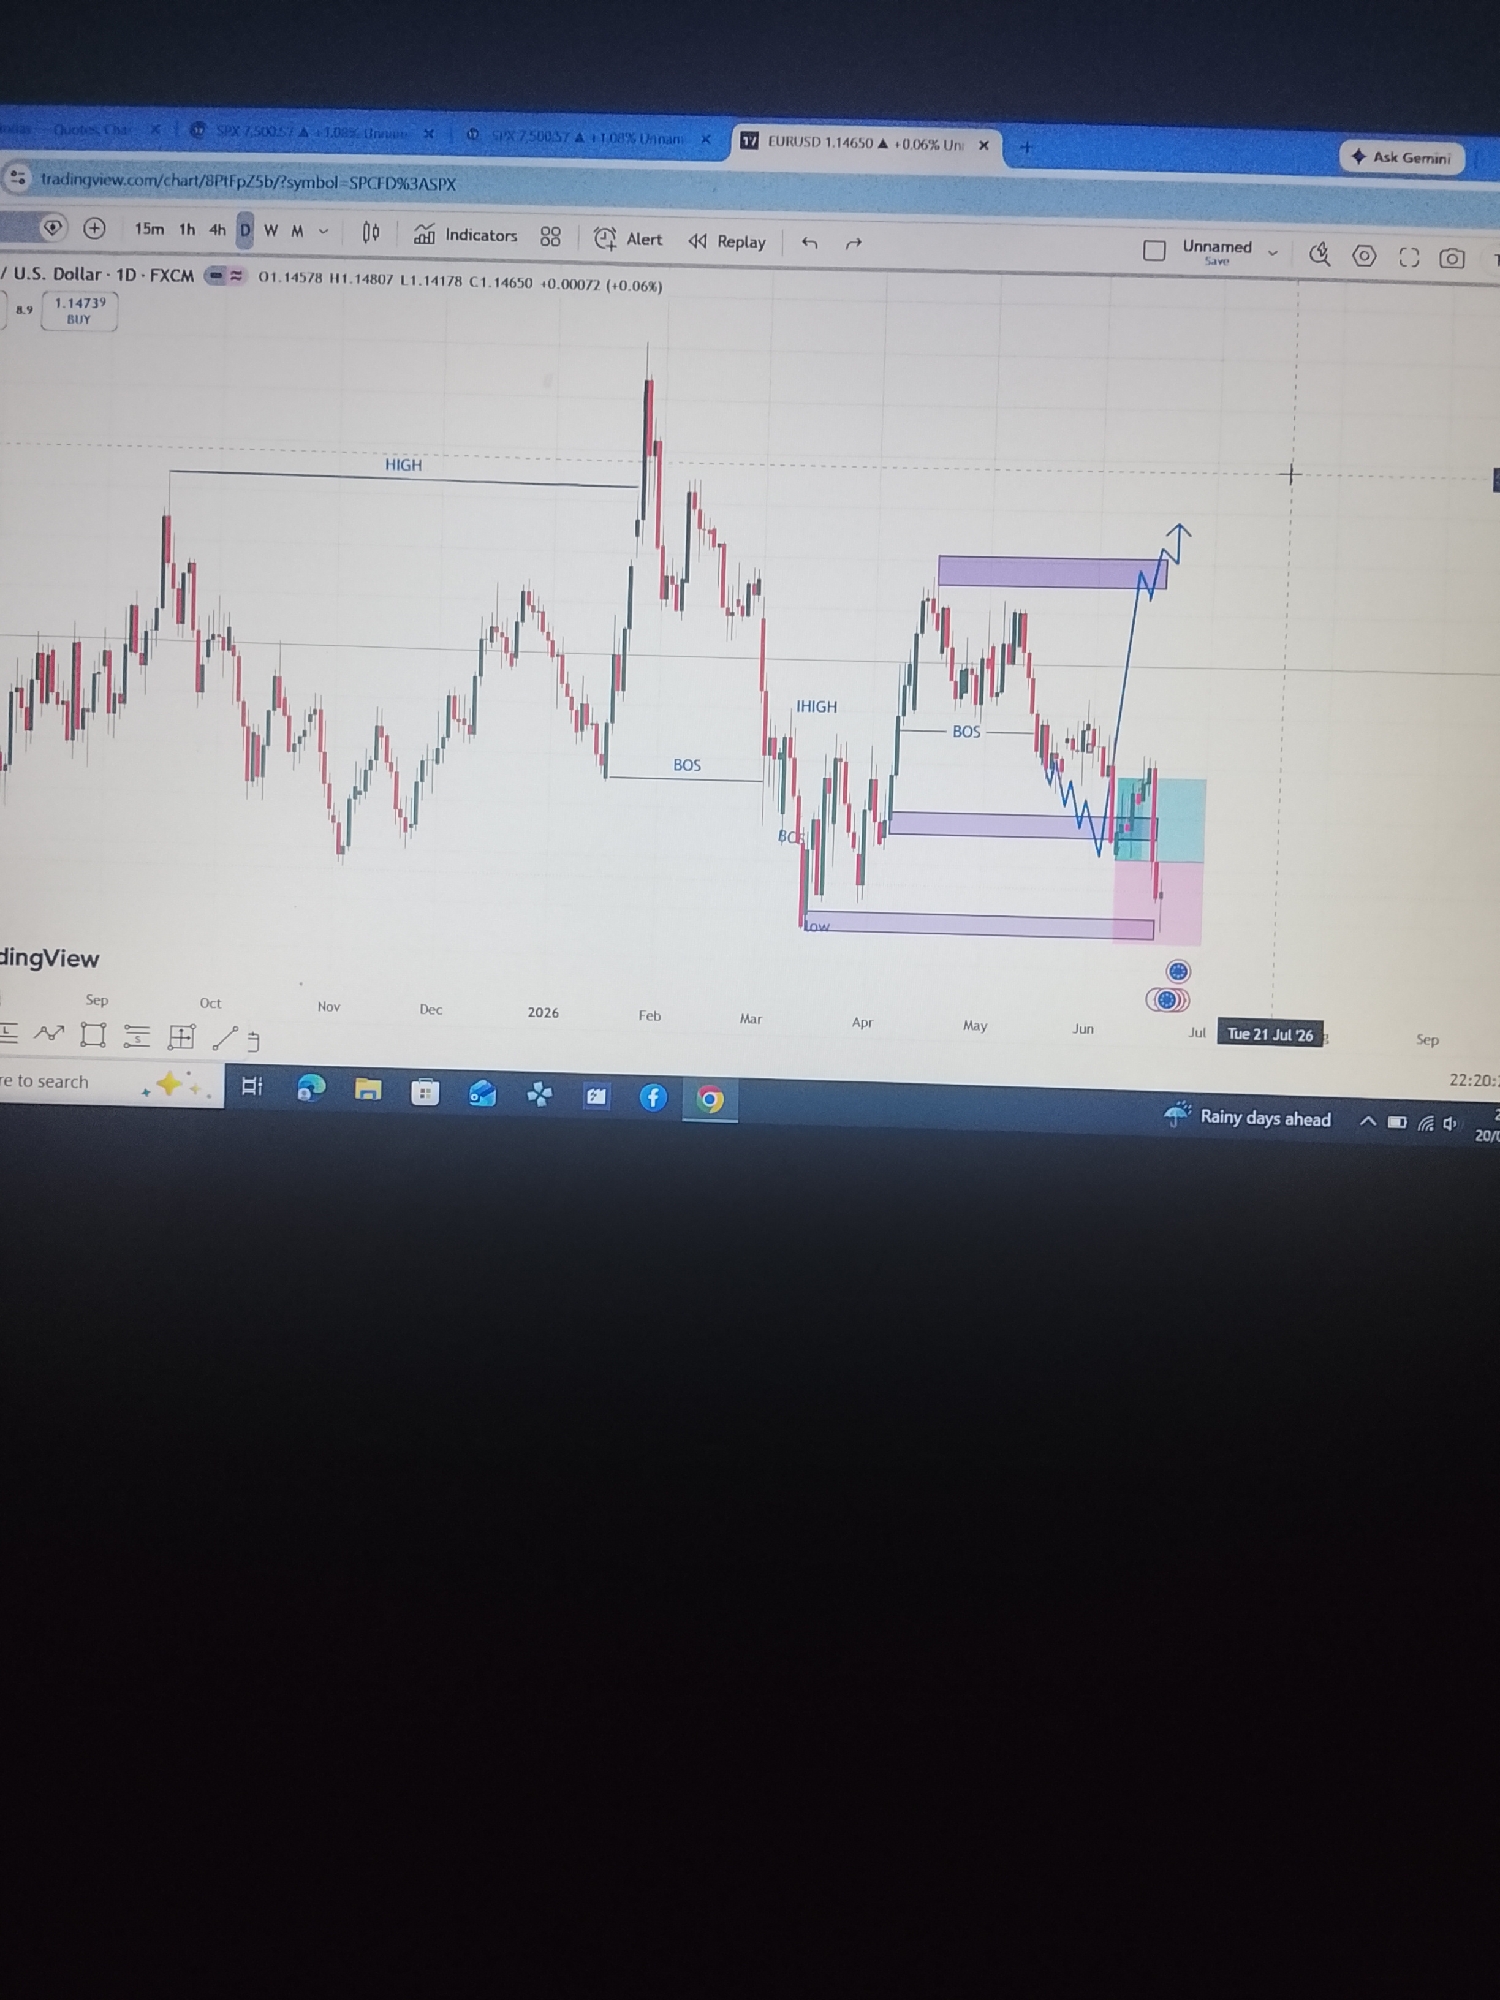
The image displays a screenshot of a financial trading platform, specifically TradingView, showing a Japanese Yen/U.S. Dollar (JPY/USD) currency pair chart. The chart is set to a daily (1D) timeframe and uses candlestick patterns to represent price movements. Several key levels and trend lines are marked on the chart, including "HIGH," "BOS" (likely Break of Structure), and "LOW." There are also colored rectangular zones, possibly indicating support and resistance areas or entry/exit points for trades. A blue line depicts a projected price movement, suggesting a potential upward trend. The screenshot also shows elements of a web browser, including tabs for other financial instruments like SPX and EURUSD, as well as browser controls and bookmarks. At the bottom of the image, a taskbar from an operating system is visible, displaying icons for various applications and system notifications, including a weather forecast indicating "Rainy days ahead." The image is taken from a screen, as indicated by the reflection and the angle of the shot. The location is not specified in the image, and therefore cannot be determined. There are no people or identifiable objects in the scene that would suggest a specific city or location.
No transactions found