Stake attention in this memory
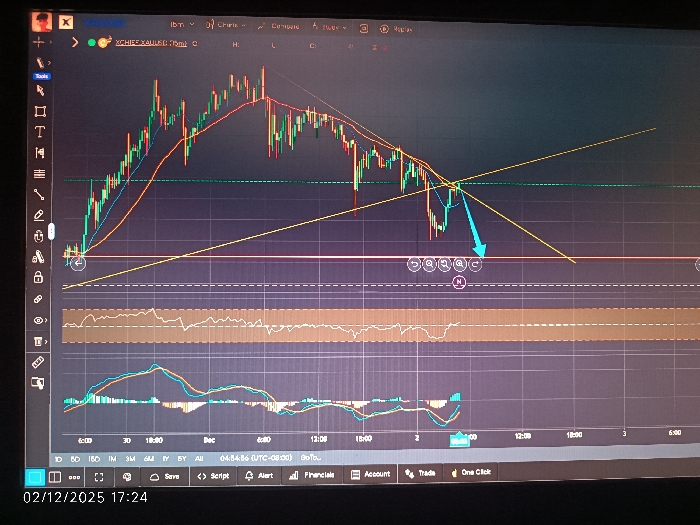
The scene depicts a digital display, presumably a computer monitor, showcasing a financial charting platform with a dark interface. The location is Herat, Afghanistan. The monitor primarily displays a candlestick chart for the 'XCH/USD' currency pair on a 75-minute timeframe. The chart features green candlesticks indicating upward price movement and red candlesticks for downward movement. Two moving average lines, colored orange and blue, are overlaid on the candlesticks, depicting trend. Multiple yellow diagonal trend lines, horizontal green and red lines, and dashed white lines mark potential support, resistance, and trend channels. A prominent bright blue arrow with a curved tail indicates a projected downward price movement from a specific point on the chart. Below the main chart, two indicator panels are visible. The upper panel shows a white oscillating line against a shaded brown background, while the lower panel presents intertwined red and blue lines with a corresponding histogram, characteristic of momentum or volume indicators. The horizontal axis denotes a timeline spanning from late November to December 3rd, with specific hourly intervals. A timestamp "04:04:36 (UTC-08:00)" is visible within the chart area. A vertical toolbar on the left side of the screen contains various drawing and analysis tools, including a cursor, trend line tool, rectangle tool, and text tool. The top bar displays navigational elements and the asset symbol "XCH/USD (75m)". A bottom toolbar provides options for different timeframes (e.g., 1D, 1M, 1Y) and functionalities such as 'Save', 'Script', 'Alert', 'Financials', 'Account', 'Trade', and 'One Click'. No human subjects or direct interactions are visible within the frame. An overlaid digital timestamp in the bottom left corner indicates "02/12/2025 17:24".
No transactions found
More from this user

More from Herat