Stake attention in this memory
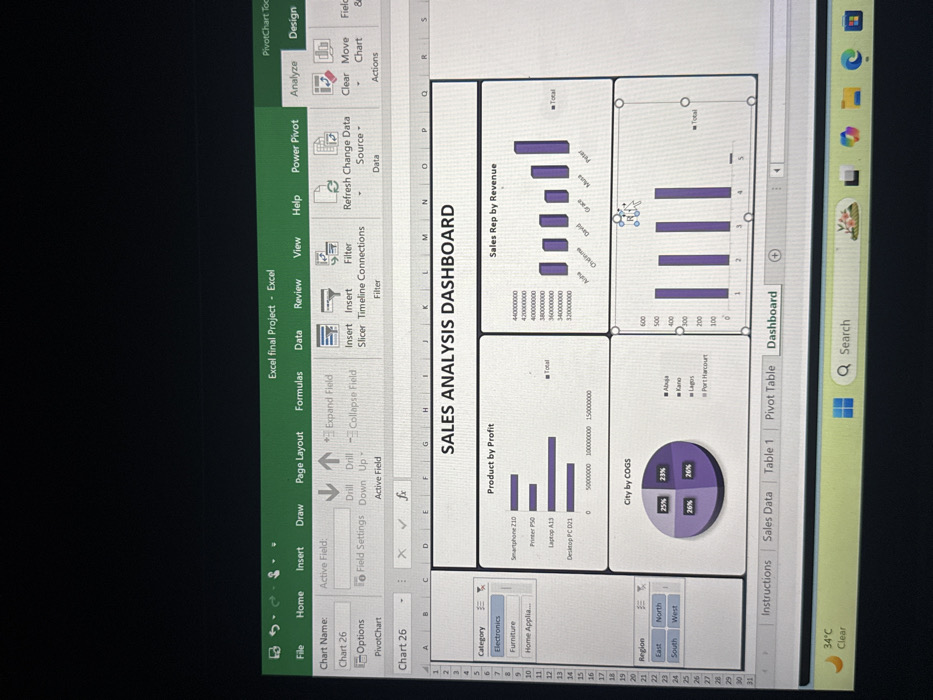
The scene depicts a computer monitor displaying a Microsoft Excel "SALES ANALYSIS DASHBOARD" in an indoor setting within Lafia, Nigeria. The dark background suggests ambient light is low. The Excel interface is prominently visible, showing the ribbon at the top with tabs like "File," "Home," and "Data." The dashboard itself is structured with multiple data visualizations: a horizontal bar chart titled "Product by Profit" (featuring items like "Smartphone Z10" and "Desktop PC D21"), a vertical bar chart labeled "Sales Rep by Revenue" (with names such as "Aisha" and "Peter"), a pie chart designated "City by COGS" (displaying percentages for "Abuja," "Kano," "Lagos," and "Port Harcourt"), and a fourth vertical bar chart without a visible title. Category and Region filters are present on the left side of the dashboard. A white mouse pointer, configured as a hand icon, rests over one of the vertical bar charts, indicating potential user interaction. The Windows taskbar is partially visible at the bottom, showing a weather indicator of "34°C Clear" and a search bar. No individuals are present in the image.
Loading AttnAds…
No transactions found