Mar 11, 2026, 12:56 PM
Stake attention in this memory
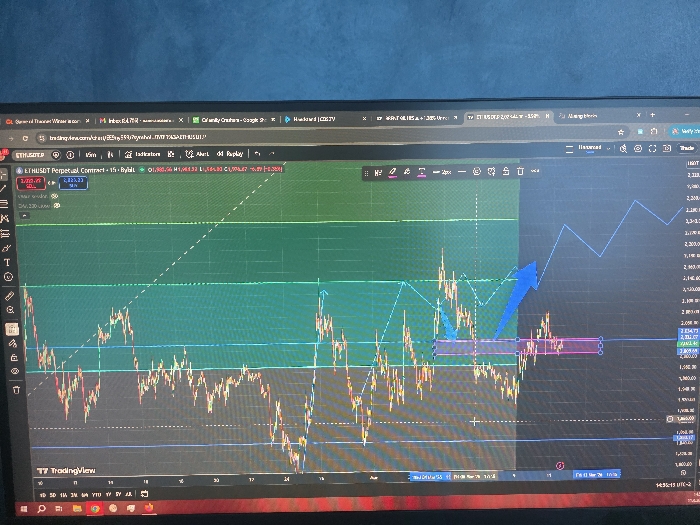
A computer monitor displays a detailed financial trading chart against a dark, textured blue background. The screen shows the TradingView platform focused on the "ETHUSDT Perpetual Contract" with a 15-minute timeframe, utilizing a candlestick chart displaying red and green price action. Overlaying the chart are several analytical tools: horizontal green lines indicating support/resistance levels, a dashed white diagonal trendline, two horizontal purple-bordered rectangular boxes highlighting specific price zones, and a prominent blue upward-pointing arrow suggesting a bullish trend. A blue zig-zag line projects a future price path. On the left, a "Long/Short" tool displays an entry price of 2,223.33 and a target of 2,826.33. The right side features a vertical price scale, with the current price visible at approximately 2,234.73. The bottom of the chart shows a timeline from early March to late March. The top of the monitor displays several open browser tabs, including "tradingview.com" and others related to general browsing. The Windows taskbar is partially visible at the very bottom of the screen. No individuals are present, and no actions or interactions are depicted beyond the display of information. The location is Unknown, Unknown.
No transactions found
More from this user

