
Stake attention in this memory
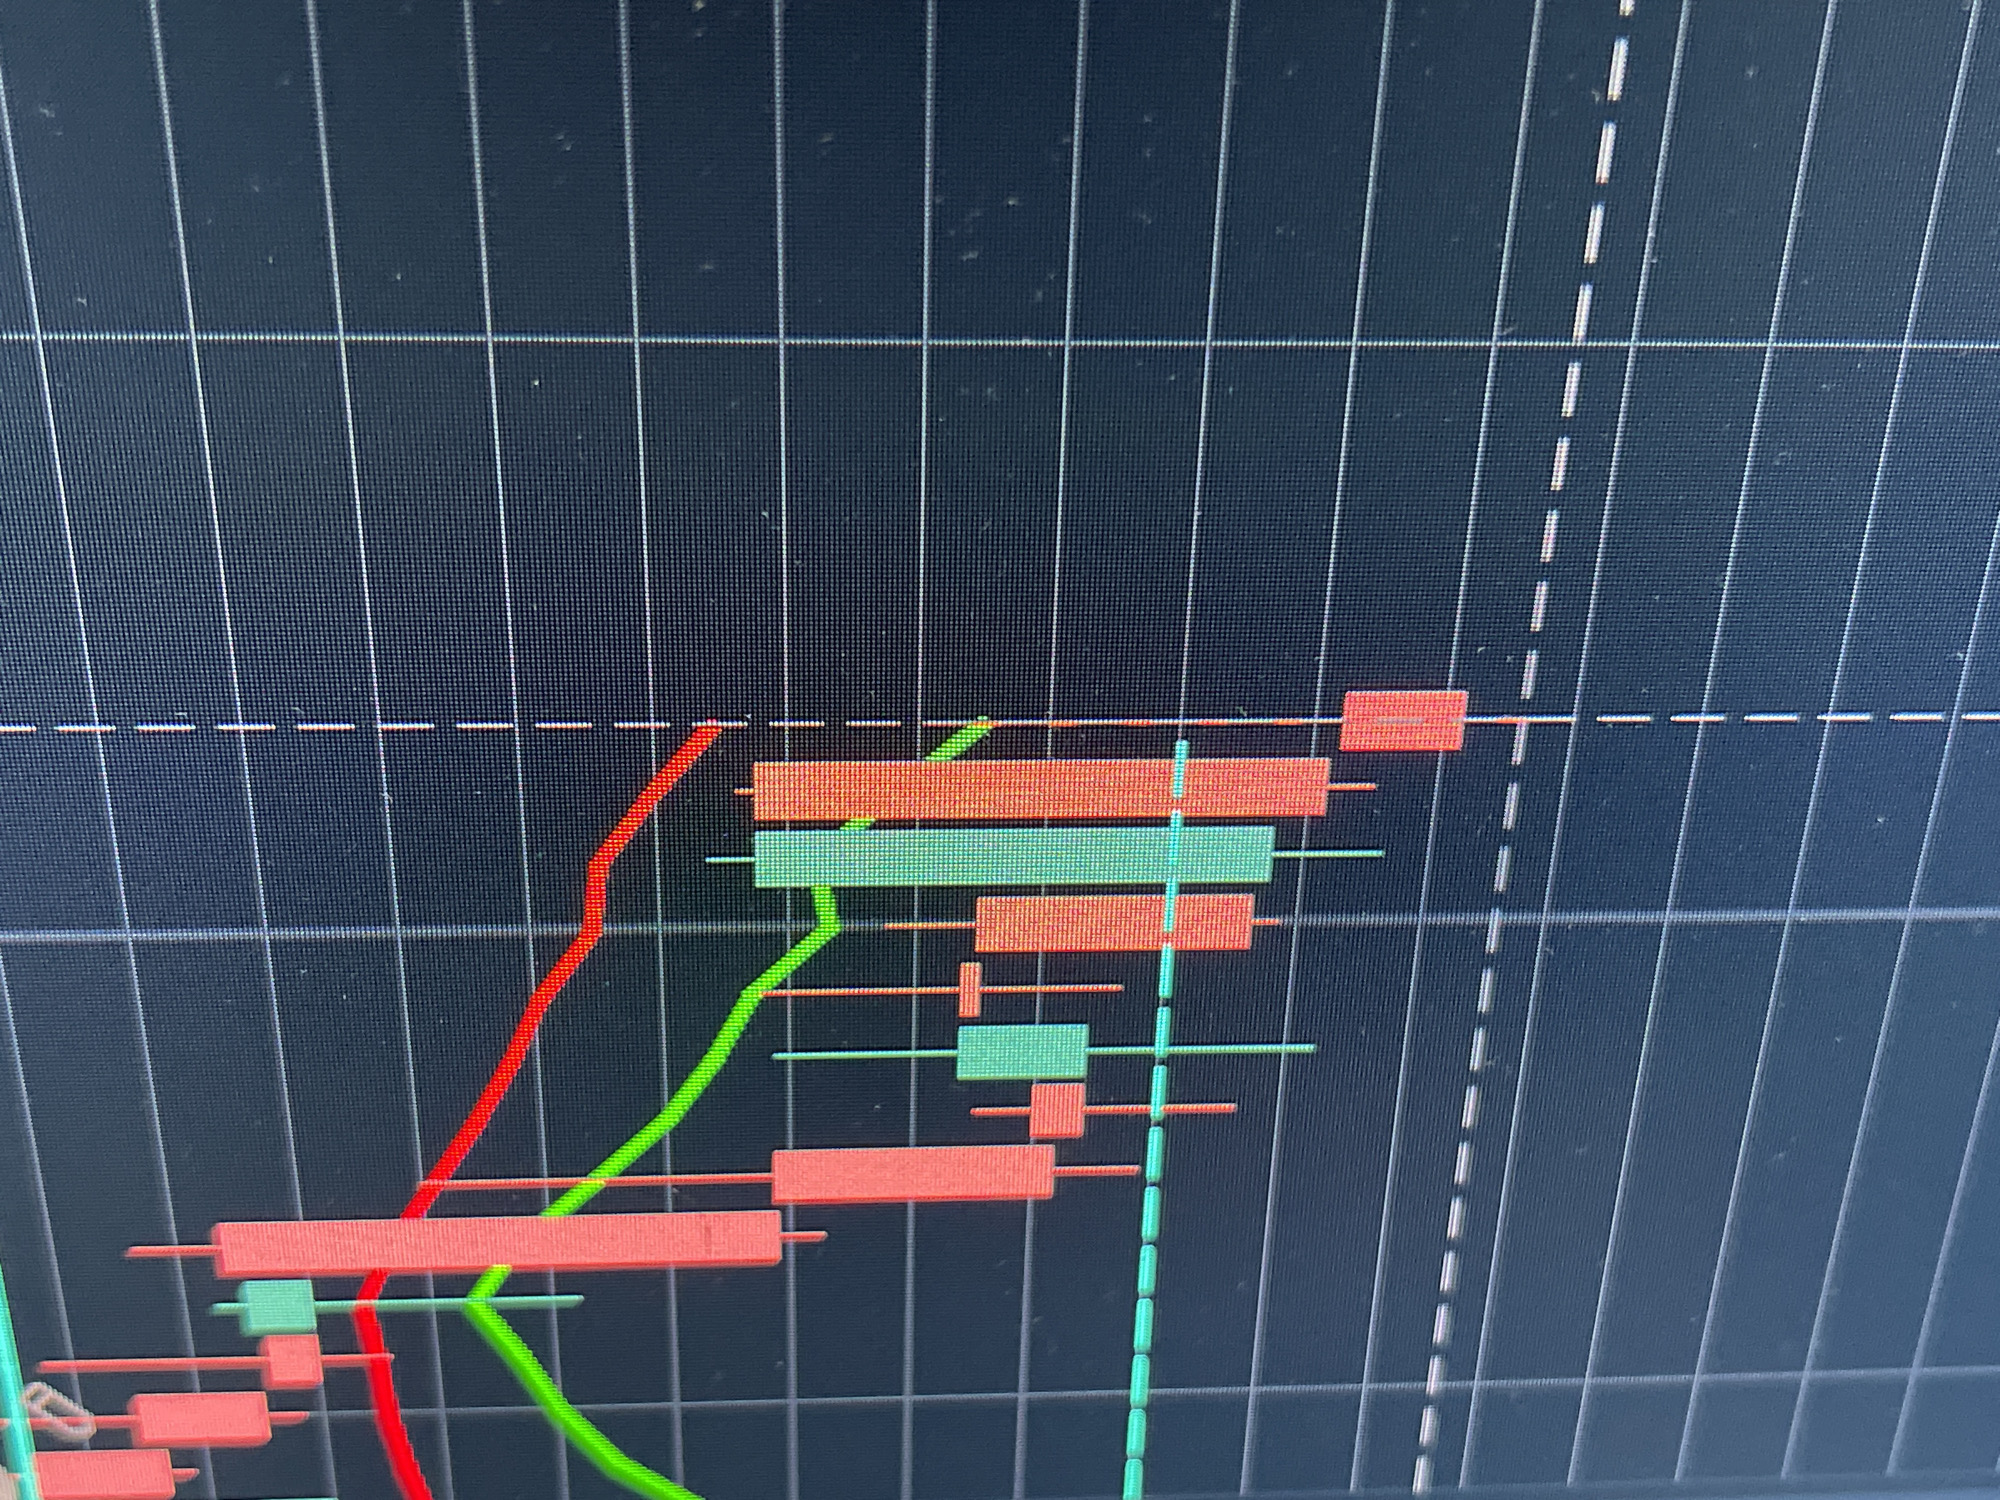
The image is a close-up, low-angle, and slightly blurry photograph of a computer screen displaying a financial trading chart. The chart shows several candlestick patterns in red and green, indicating price movements over time. Red candlesticks generally represent a price decrease, while green candlesticks represent a price increase. Two lines, one red and one green, are also visible, likely representing moving averages or other indicators. The background of the screen is dark, with a grid overlay of thin white horizontal and vertical lines. A dashed white horizontal line is also present. There are no people, animals, or specific landmarks visible, and the image provides no information about the city of Gresham, United States of America. The focus is solely on the abstract visual representation of market data on a digital display.
Loading AttnAds…
No transactions found