
Stake attention in this memory
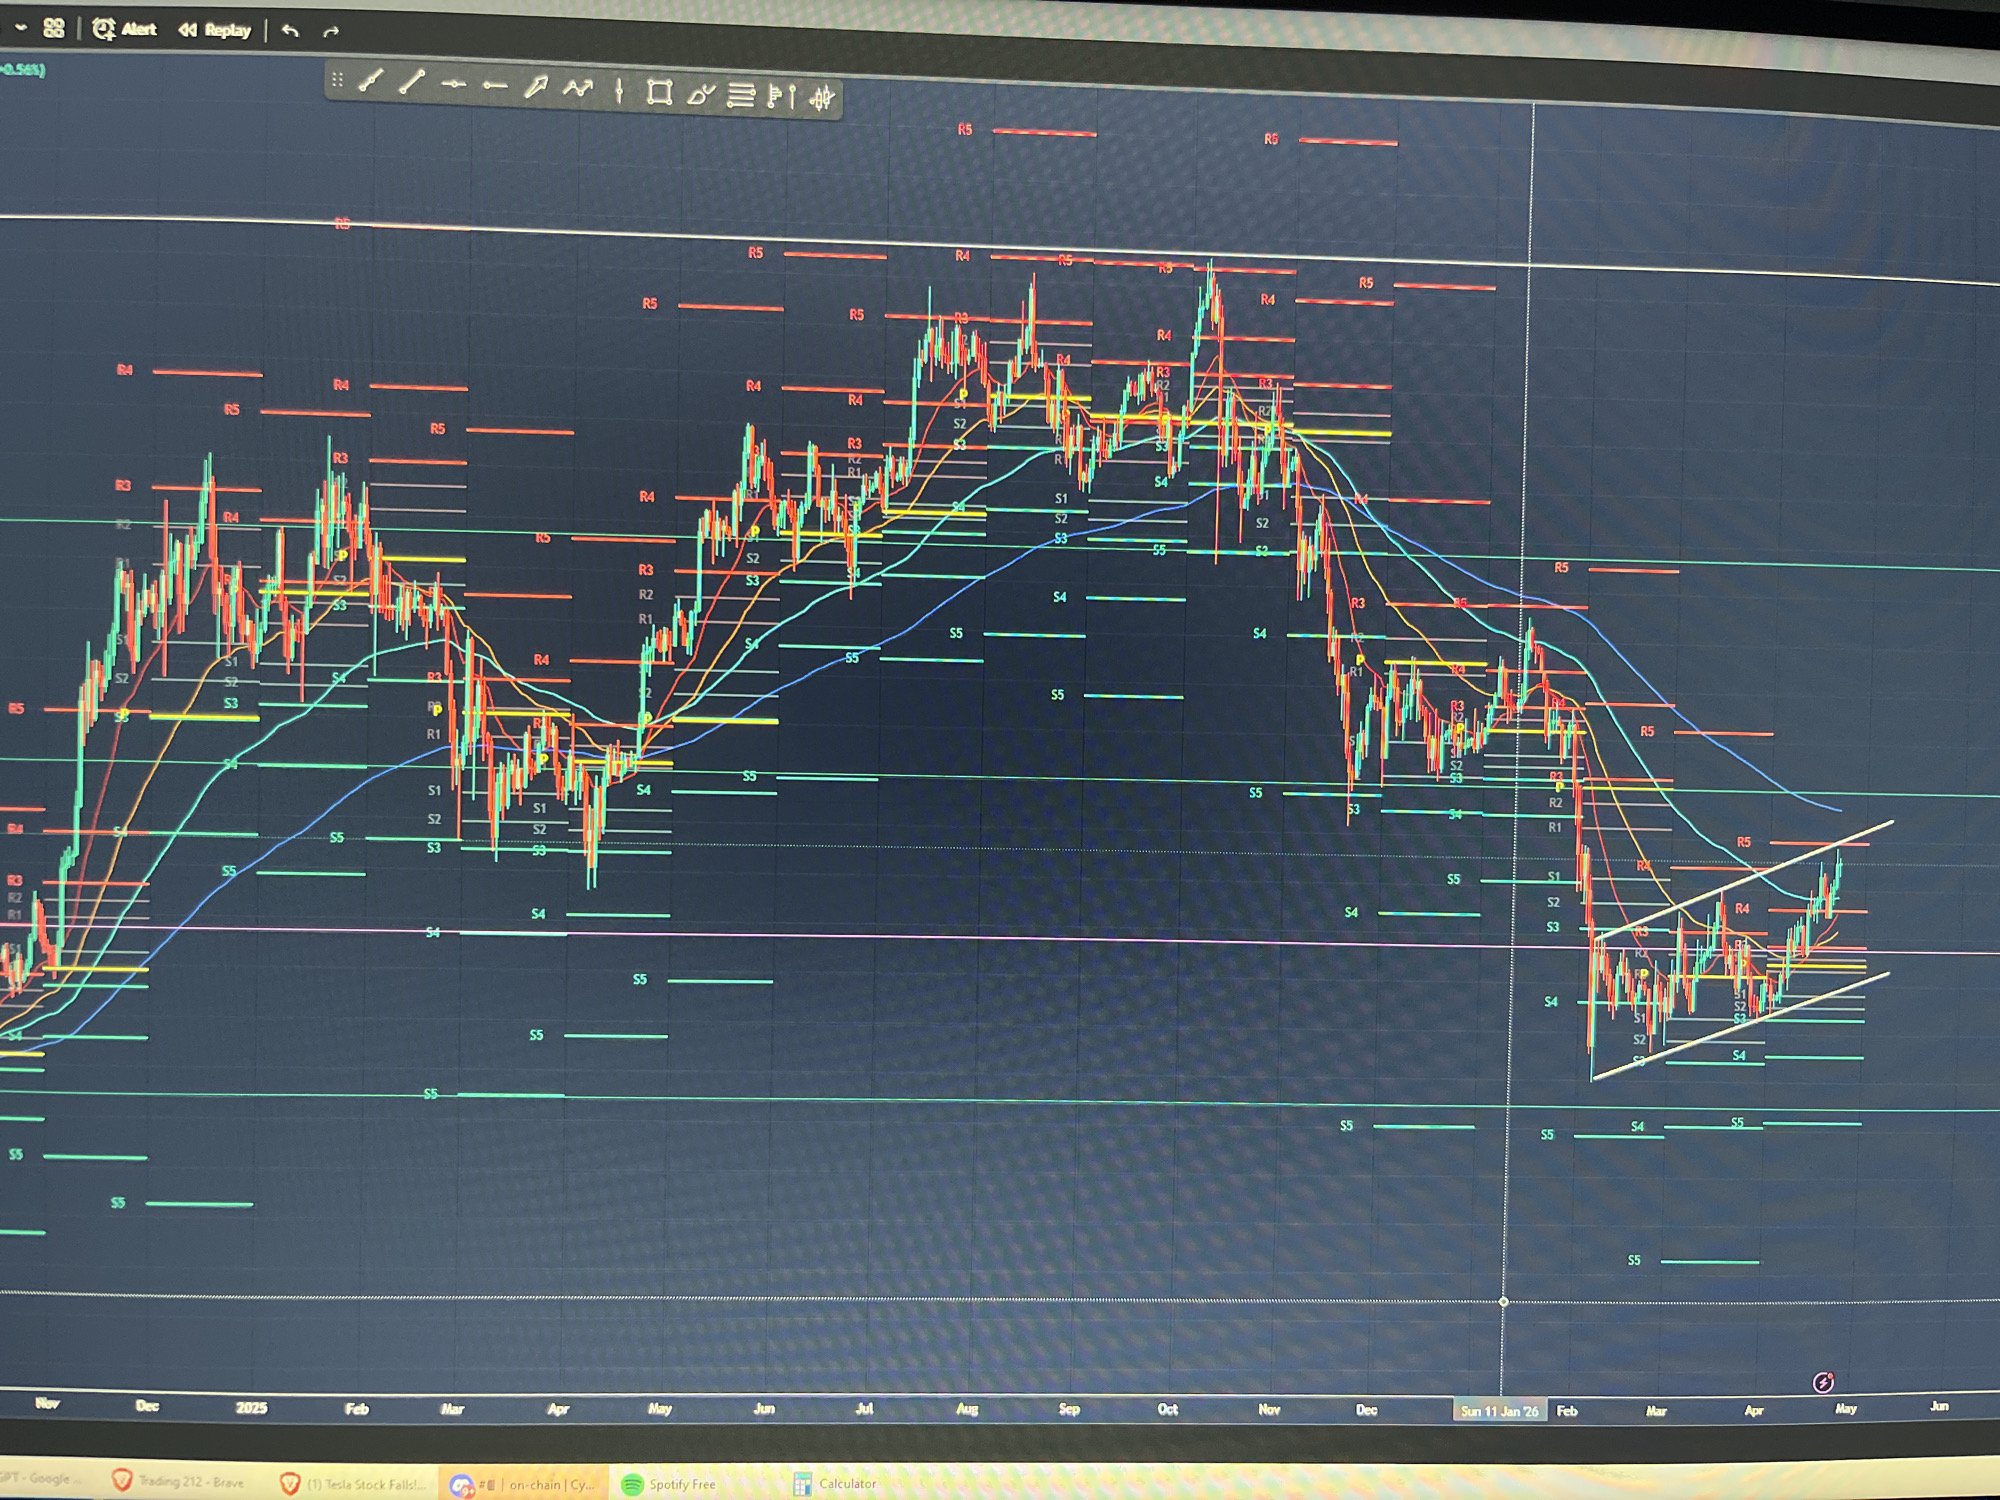
The image displays a close-up, angled shot of a computer monitor showing a detailed financial candlestick chart on a dark background. The chart features green and red candlesticks representing price movements over time. Multiple lines and indicators are overlaid on the chart, including light blue, yellow, and darker blue moving average lines. Horizontal red and green lines, labeled with "R" (R1-R5) and "S" (S1-S5), indicate resistance and support levels. Two prominent white diagonal trendlines suggest a possible ascending channel in the more recent price action on the right side of the chart. At the top left of the screen, a small percentage "-0.56%" is visible. The top bar of the charting software includes icons for "Alert" and "Replay," along with various drawing and analysis tools. The x-axis of the chart shows dates, ranging from "Nov" and "Dec" of what appears to be late 2024 (implied by "2025" and "Sun 11 Jan 26" labels) into "May" and "Jun" of 2026. Below the main screen display, parts of several open application windows are visible on what appears to be the Windows taskbar. These include text snippets like "GPT-Google," "Trading 212 - Brave," "(1) Tesla Stock Falls!...", "# on-chain | Cy...", "Spotify Free," and "Calculator." The monitor screen has subtle reflections, suggesting an indoor setting with ambient light. No people are visible.
Loading AttnAds…
No transactions found