Sign in
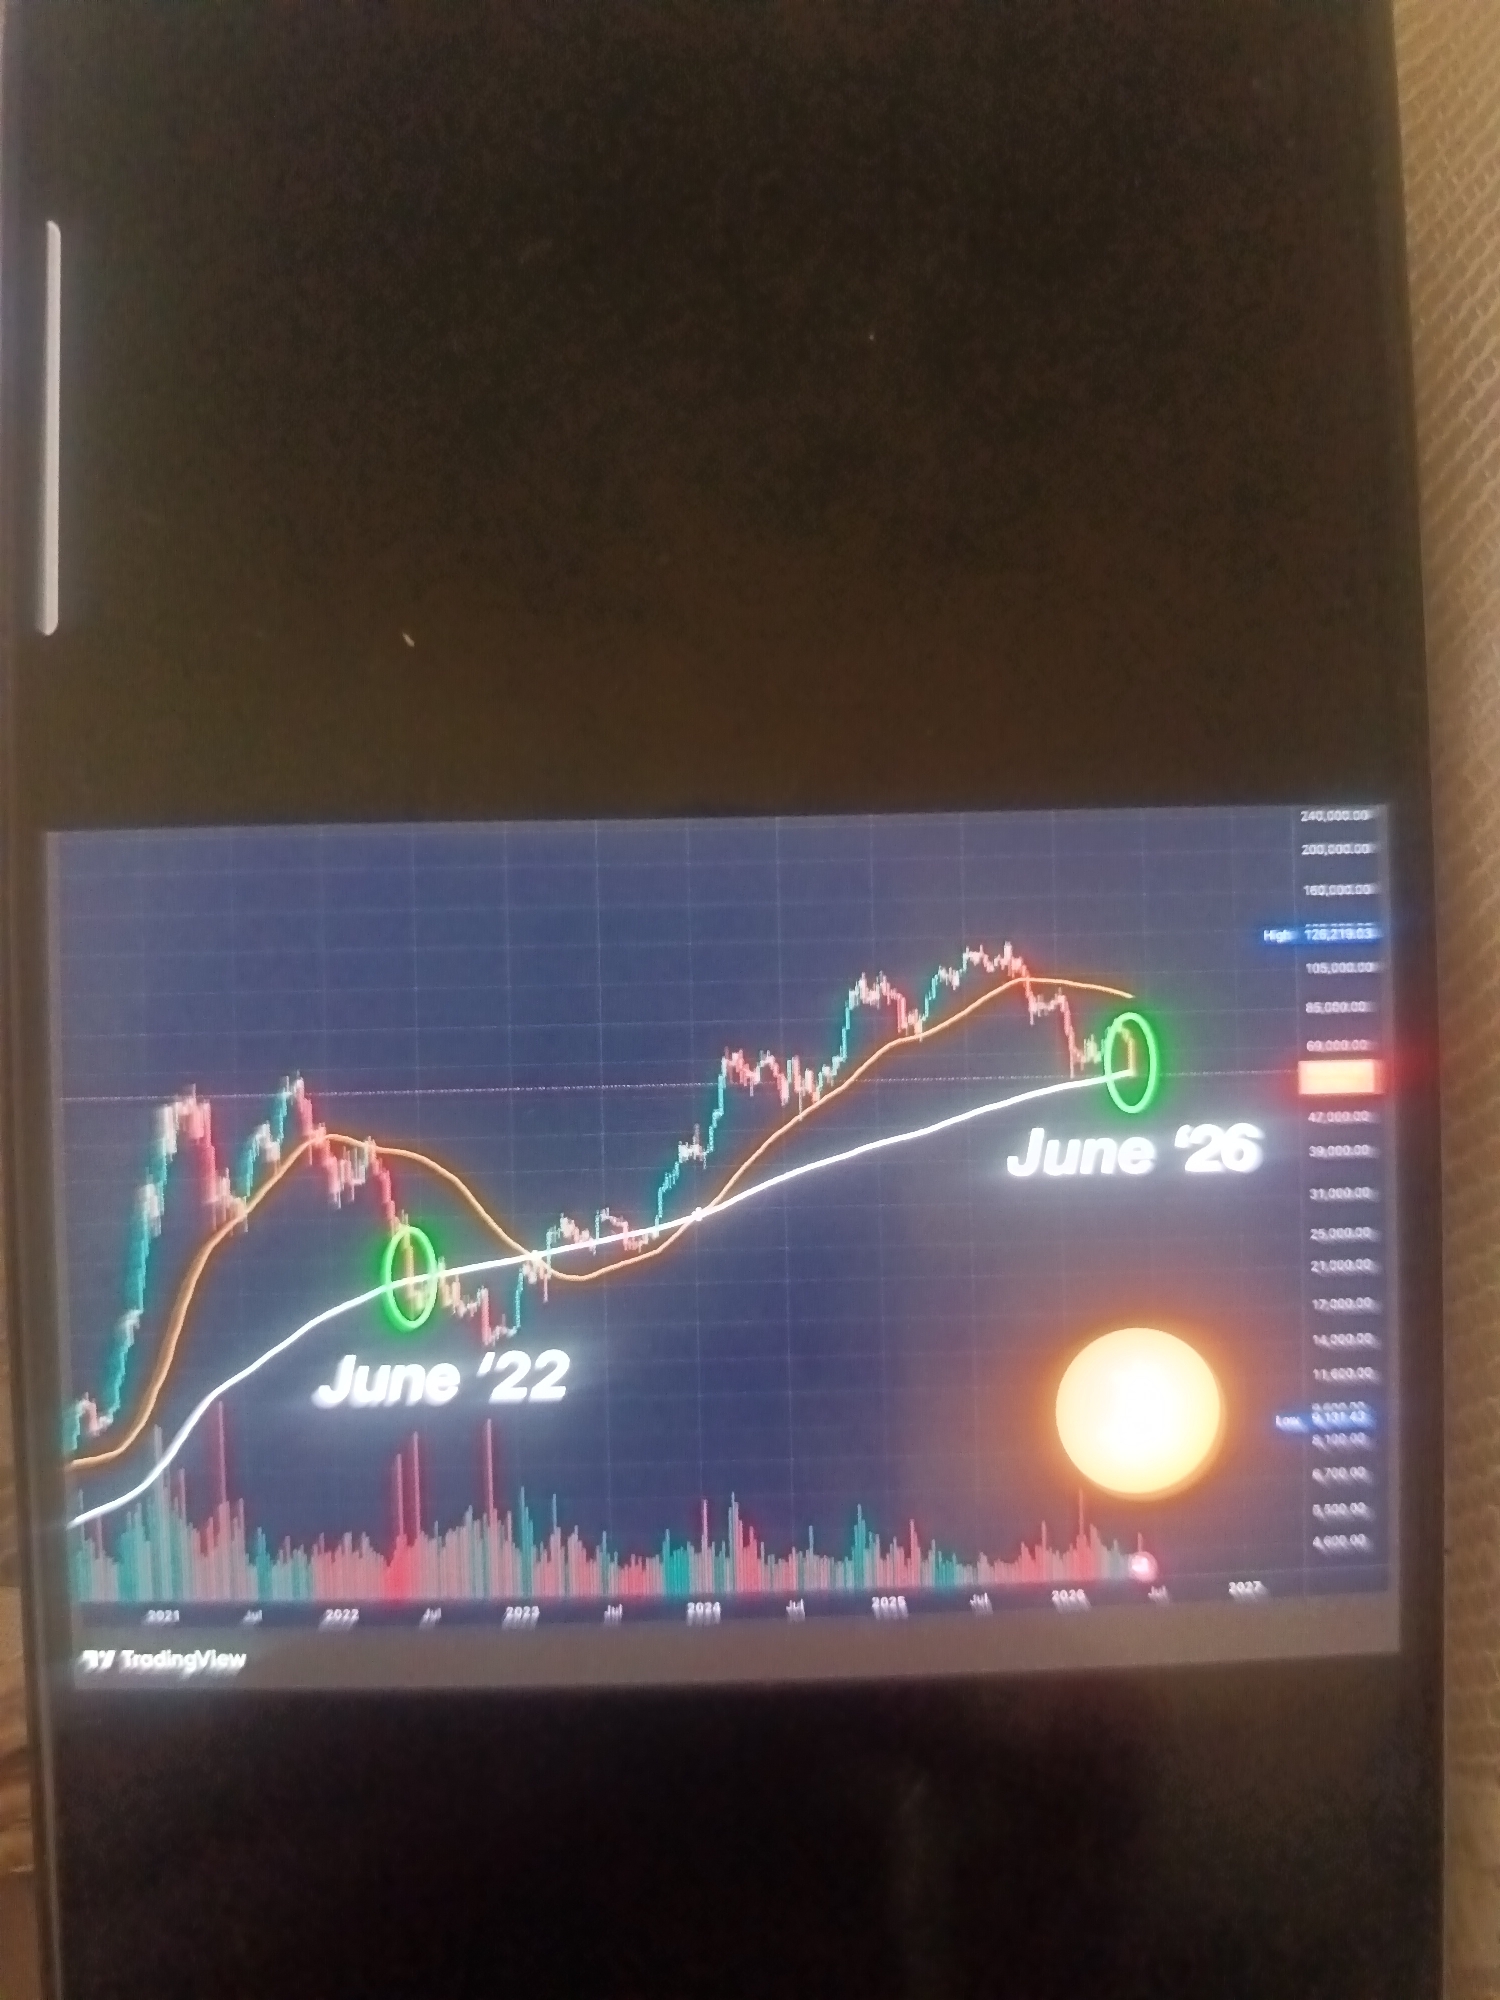
The image displays a dark-colored digital screen, likely a smartphone or tablet, presenting a financial candlestick chart on a dark blue grid background. The screen is positioned against a light-colored, textured surface, possibly fabric, visible along the right and top edges. A white vertical reflective line is present on the left side of the device's bezel.

The chart, attributed to "BY TradingView," illustrates price action from late 2020 to mid-2027, with a vertical axis showing price levels ranging from 4,600.00 to 240,000.00. Candlesticks are rendered in green and red, indicative of market movements. Two moving average lines are superimposed: an orange line closely tracking the price and a smoother white line.

Specific annotations include "June '22" and "June '26," each pointing to a trough in price action near the white moving average, highlighted by a green elliptical circle. A prominent, bright yellow-orange circular graphic is overlaid on the lower right portion of the chart, obscuring underlying data for approximately the years 2026 to 2027. Price values of "High: 128,218.83" and "Low: 9,101.42" are visible in blue text boxes on the right-hand Y-axis. The location is unknown within the city of Unknown, Unknown.
T
Trader

Jun 6, 2026, 11:40 AM

Unknown, Unknown

BLOCKED

Stake attention in this memory

analysis
investment
finance
data
strategy

The image displays a dark-colored digital screen, likely a smartphone or tablet, presenting a financial candlestick chart on a dark blue grid background. The screen is positioned against a light-colored, textured surface, possibly fabric, visible along the right and top edges. A white vertical reflective line is present on the left side of the device's bezel. The chart, attributed to "BY TradingView," illustrates price action from late 2020 to mid-2027, with a vertical axis showing price levels ranging from 4,600.00 to 240,000.00. Candlesticks are rendered in green and red, indicative of market movements. Two moving average lines are superimposed: an orange line closely tracking the price and a smoother white line. Specific annotations include "June '22" and "June '26," each pointing to a trough in price action near the white moving average, highlighted by a green elliptical circle. A prominent, bright yellow-orange circular graphic is overlaid on the lower right portion of the chart, obscuring underlying data for approximately the years 2026 to 2027. Price values of "High: 128,218.83" and "Low: 9,101.42" are visible in blue text boxes on the right-hand Y-axis. The location is unknown within the city of Unknown, Unknown.

Symbol

A2EAD

Volume

0

Creator

+$0.11

Revenue

+$0.00

TVL

$0.00

1D
1W
1M
All

Loading AttnAds…

transactions
revenues
stakers
Earliest
Latest
Highest stake

1

A
Avagyan

Staked 2mo ago
Redeemed 2mo ago

$2.93 USD

+$0.00 USD

Fee: $0.08 (2.5%)

+0.1%

2

Rev Bot 🤖💰

Injected revenue 2mo ago

Revenue bonus for the last stake.

+$0.08 USD

3

FM-BQNZk1

Staked 2mo ago
Redeemed 1mo ago

$2.93 USD

+$0.02 USD

Fee: $0.01 (0.25%)

+0.6%

4

Rev Bot 🤖💰

Injected revenue 2mo ago

Revenue bonus for the last stake.

+$0.07 USD

5

Tyom93

Staked 2mo ago
Redeemed 1mo ago

$2.93 USD

+$0.00 USD

Fee: $0.01 (0.25%)

+0.1%

6

Rev Bot 🤖💰

Injected revenue 2mo ago

Revenue bonus for the last stake.

+$0.08 USD

More from this user

More from Unknown

Nearby

this memory

nearby events

TTrader

Jun 6, 2026, 11:40 AM

Unknown, Unknown

Licensed under Creative Commons Attribution 4.0 International License. You are free to share and adapt this content with proper attribution.