Stake attention in this memory
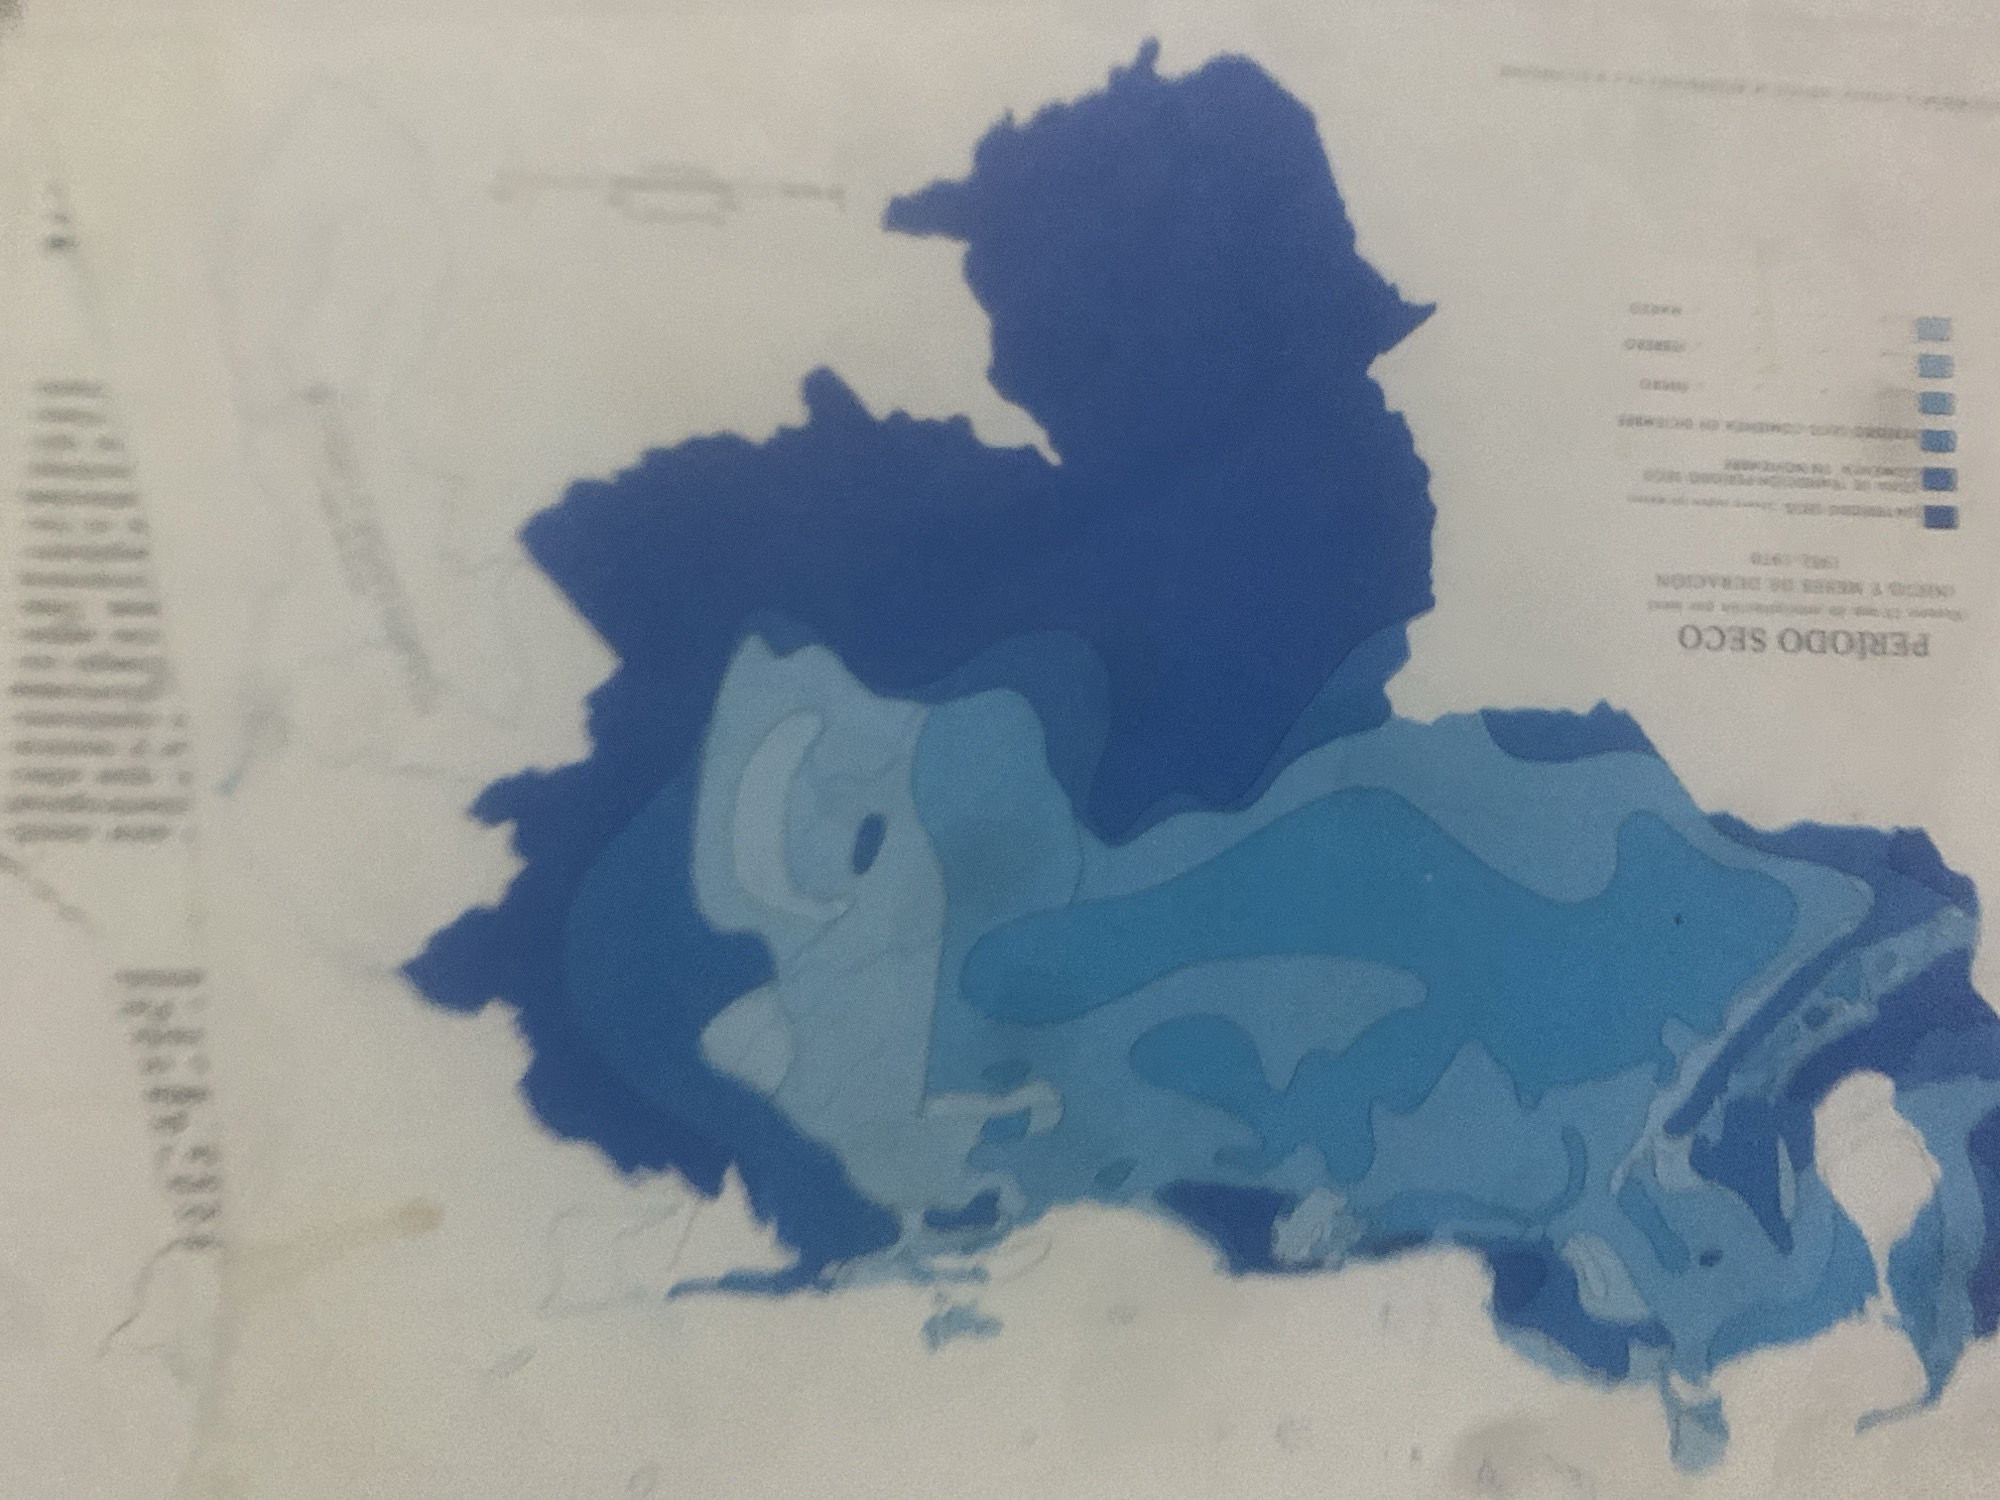
This is a photograph of a map, likely a meteorological or geographical map, featuring a large, irregular blue shape that resembles a landmass or a region on a map. The map is primarily composed of different shades of blue, indicating variations in some measured quantity, possibly rainfall, temperature, or drought severity. The different shades are presented in distinct areas, creating a contour-like effect. To the right of the blue shape, there is a legend with several colored rectangles, each corresponding to a different shade of blue seen on the map. Above the colored rectangles, there is text, including the words "PERIODO SECO" (Dry Period) and "MESES DE DURACION" (Months of Duration), suggesting that the map illustrates the length of dry periods in different locations. Further text, though mostly illegible due to blurriness and image resolution, appears to be providing labels or descriptions for the data represented. On the left side of the map, there is a vertical column of text, also largely illegible, which might be a key, an index, or descriptive information related to the map's content. The background of the image is a light, off-white color, with some subtle textures and possibly faint lines or markings that are not clearly discernible. The overall scene depicts a visual representation of data, likely related to climate or geography in La Tagua, Venezuela, as indicated by the location context. No people or specific objects are visible, other than the map itself. The time of day and weather conditions are not ascertainable from the image. The focus is entirely on the cartographic representation of the data.
Symbol
A3160
Volume
11,550
Creator
+$0.14
Revenue
+$0.25
TVL
$11.65
2
Rev Bot 🤖💰
Injected revenue 6d ago
“Revenue bonus for the last stake.”
+$0.28 USD