Stake attention in this memory
anxiety
uncertainty
tension
stress
nervousness
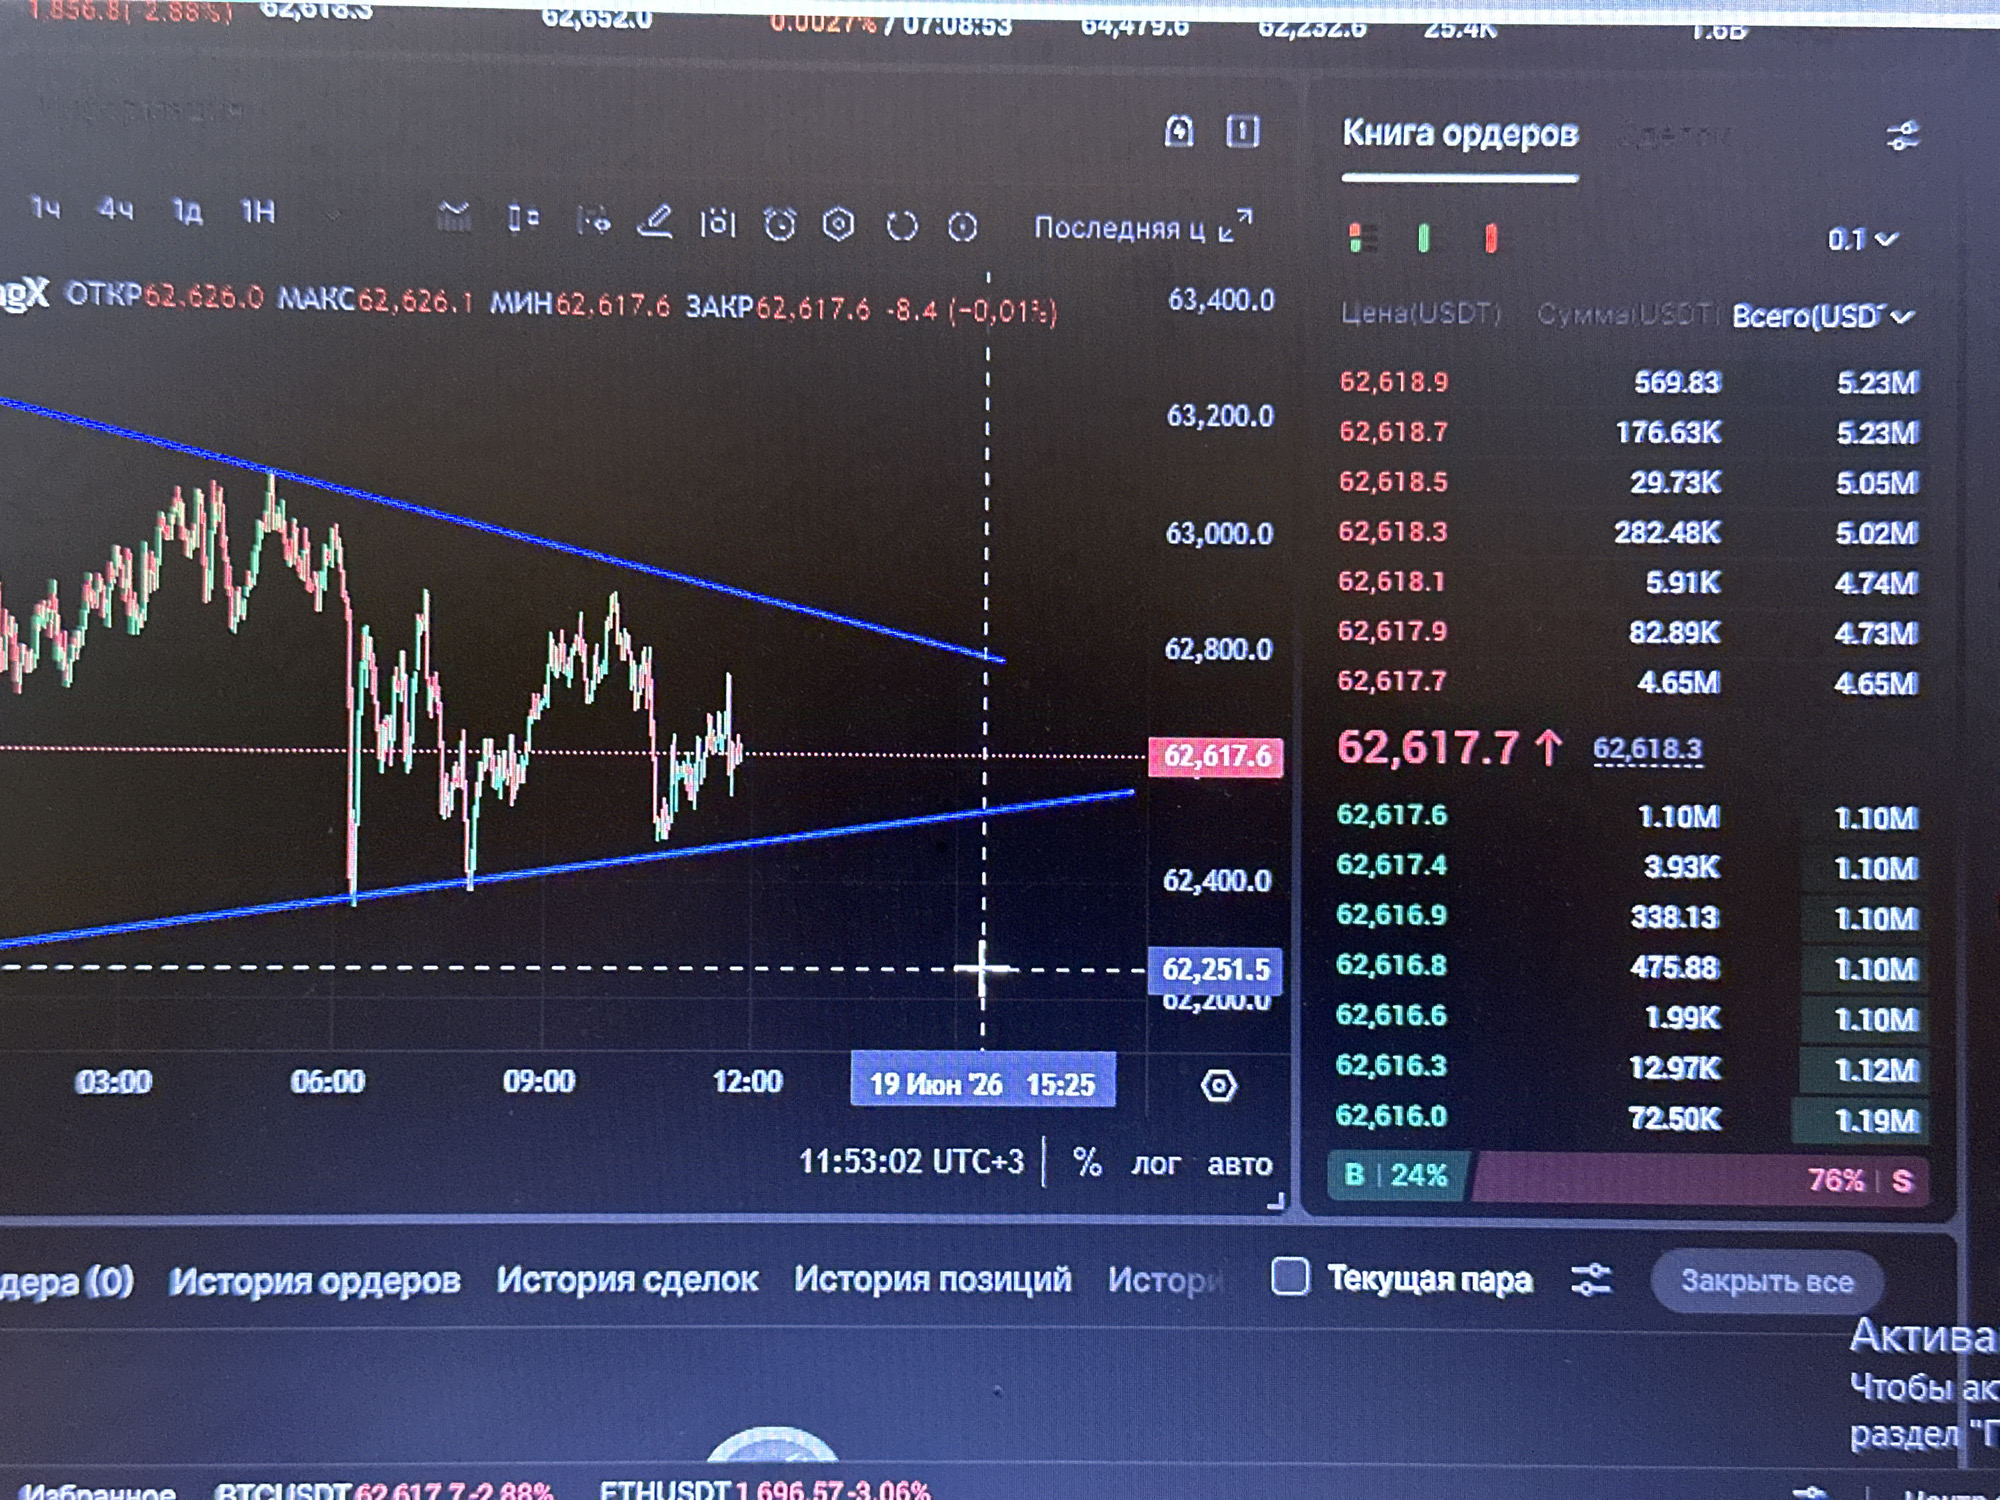
The image displays a screenshot of a cryptocurrency trading platform. A candlestick chart showing price fluctuations of a cryptocurrency is visible on the left side. The chart is overlaid with blue trendlines forming a triangle pattern. Numerical data, including prices, quantities, and percentages, are displayed on the right side in columns labeled "Цена (USDT)", "Сумма (USDT)", and "Всего (USD)". A date and time stamp indicates "19 Июн '26 15:25" and "11:53:02 UTC+3". Below the chart, various trading interface options such as "История ордеров", "История сделок", and "Текущая пара" are visible. The overall scene is a digital interface for financial trading.
Symbol
A80DF
Volume
0
Creator
+$0.00
Revenue
+$0.00
TVL
$0.00
1D
1W
1M
All
transactions
revenues
stakers
Earliest
Latest
Highest stake