
Sign in
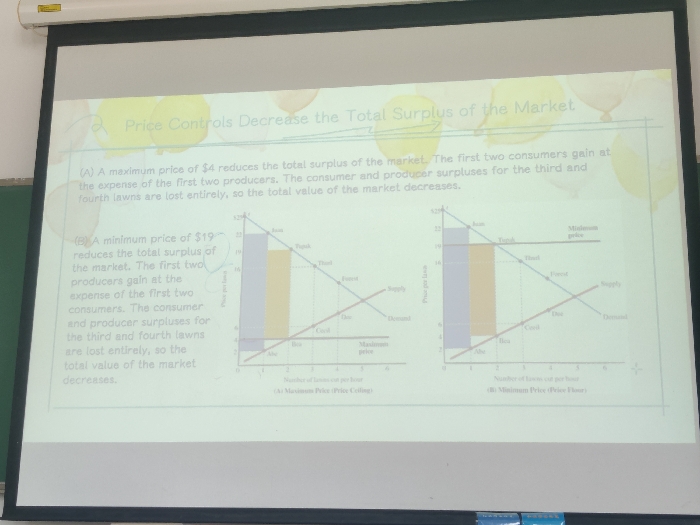
The image displays a presentation slide illustrating how price controls decrease the total market surplus. Part (A) explains that a maximum price of $4 reduces the surplus, with consumers gaining at the expense of producers. The third and fourth lawns are lost entirely. Part (B) describes a minimum price of $19, which also reduces the total surplus, with producers gaining at the expense of consumers. Again, the third and fourth lawns are lost, reducing the total market value. The slide uses graphs to visualize the effects of price ceilings and floors on supply and demand.
Roti

Dec 8, 2025, 2:09 AM

Daxing District, China

Stake attention in this memory

economics
graphs
charts
market
price control

The image displays a presentation slide illustrating how price controls decrease the total market surplus. Part (A) explains that a maximum price of $4 reduces the surplus, with consumers gaining at the expense of producers. The third and fourth lawns are lost entirely. Part (B) describes a minimum price of $19, which also reduces the total surplus, with producers gaining at the expense of consumers. Again, the third and fourth lawns are lost, reducing the total market value. The slide uses graphs to visualize the effects of price ceilings and floors on supply and demand.

Loading AttnAds…

transactions
revenues
stakers
Earliest
Latest
Highest stake

No transactions found

More from this user

More from Daxing District

Roti

Dec 8, 2025, 2:09 AM

Daxing District, China

Licensed under Creative Commons Attribution 4.0 International License. You are free to share and adapt this content with proper attribution.